NQ: Trading the unbalance of the Volume Profile
Trading NQ on volume profile with ES imbalance; short that does not go short with absorption and price action diverging with sell aggressor
Trading with volumes is certainly not easy, as with any other technique.
Volumetric analysis presupposes an in-depth knowledge of what you are looking at, and what we have witnessed today is one of the cases that happen when we analyze the evolution of the composition of the daily Volume Profile of a financial instrument. A small mention should be made of what the Volume Profile is, that is the horizontal graphic representation of the volumes traded, or rather how many contracts or shares on each single trading tick have been executed.
The VP (we will call it that from here on), can take on different forms, and the most classic is the bell shape, typical of a Gaussian distribution.
In probability theory, the Gauss curve is a probability distribution used to describe real-valued random variables that tend to concentrate around a single mean value, which in the case of volumetric analysis is called POC (point of control). Since the probability in a normal trading day is greater than this "bell" must form, the trader who follows the volumetric analysis, tries to perceive how the volumetric distribution is evolving, and if he sees a possible evolution that could lead to the price on one side with higher probabilities than the other, tries to deepen the analysis trying to understand if more elements in confluence can increase the probability of a positive success of a trade.
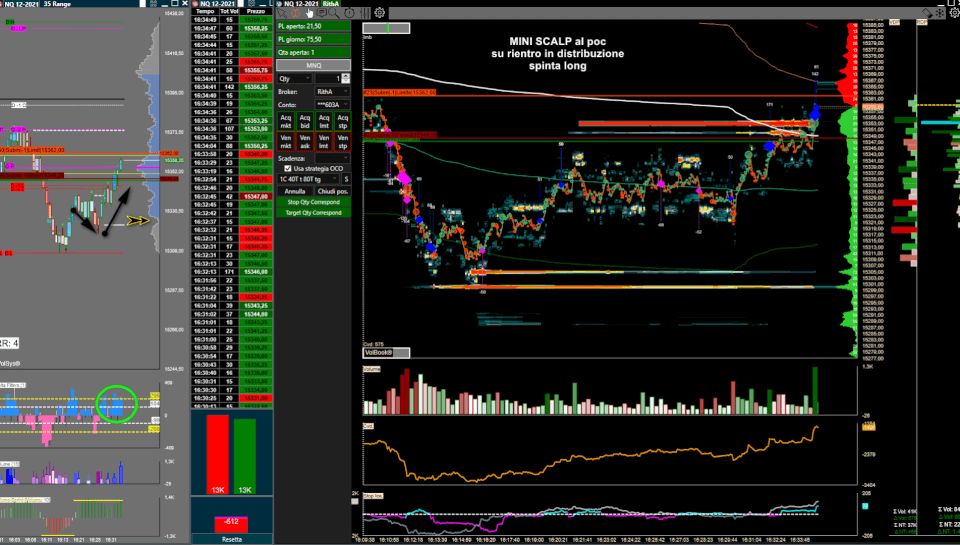
What we post below is a trade executed on Nadaq futures, which has much of its origin in the analysis of the imbalance of the VP on SP500.
As can be seen from SP 30 min, the POC positioned north of the distribution gave the perception that the volumetric distribution should develop by making higher prices.
The confluences came to our aid at this point, as from here we added the analysis of the aggressive short part that was taking place on SP 1 min but which, as you can see, did not give any result, indeed at rising prices, short pressure corresponded growing (short that doesn't go short). When these things happen, we talk about absorbing the attackers.
The Nasdaq as seen from NQ 7 Range, has exhausted its short strength in relative lows and has made a false break on the green distribution, which has given the go-ahead for the long trade which has brought us good satisfactions.
Are you intersted on what you are seeing?
If you want more information about our services, please contact us leaving your email or mobile phone.