VolSys® is a professional trading platform whose main focus is Order Flow Analyzer, Volume Profile, Time & Sales and Order Flow analysis. We have developed many proprietary indicators based on our market experience and partner traders.
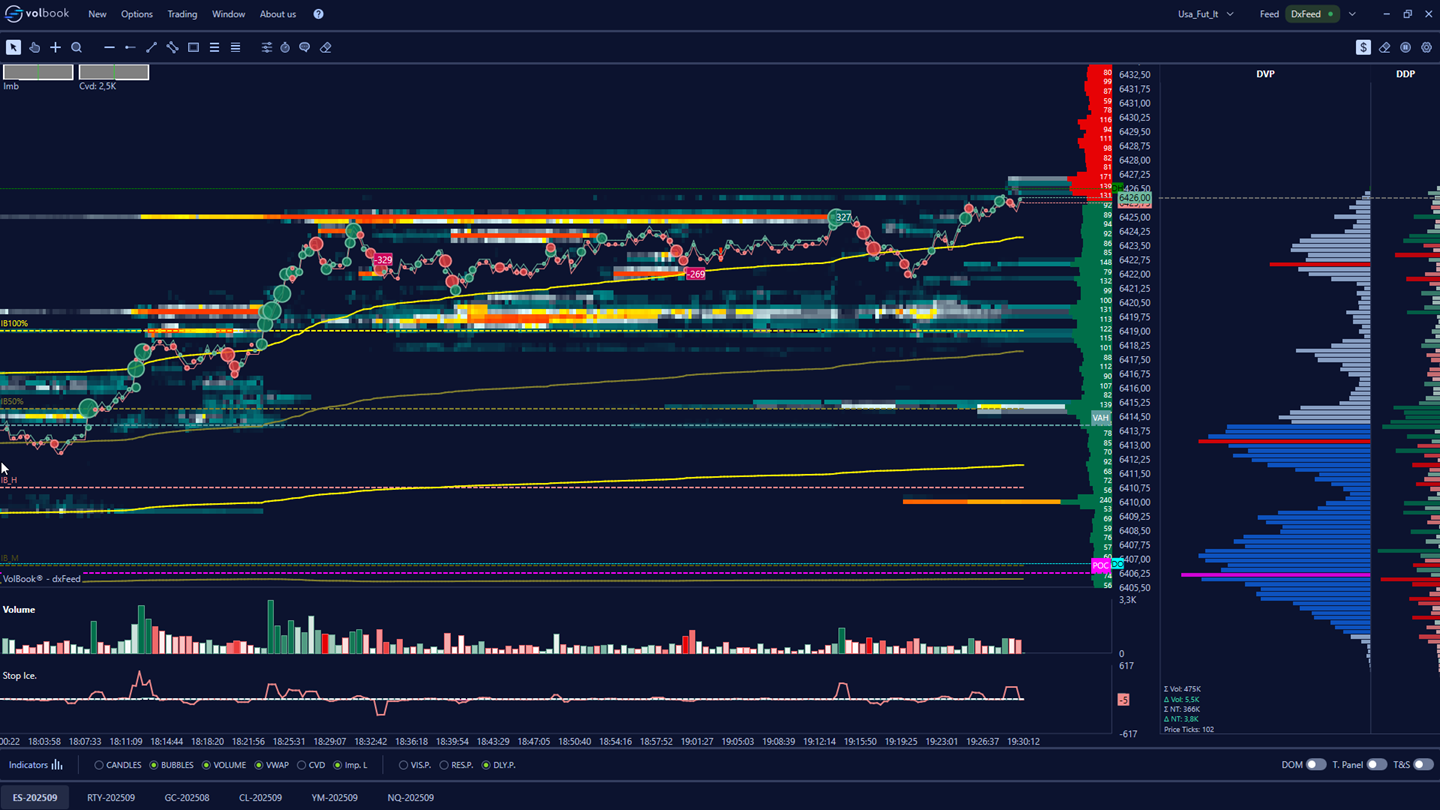
VolBook® is a professional volumetric trading platform and offers an innovative way to visualize and analyze market depth, level 2, without neglecting the study of level 1.we made a tremendous effort to build a lightweight, clear and functional proprietary heatmap.
VolSys® is a professional trading platform whose main focus is Order Flow Analyzer, Volume Profile, Time & Sales and Order Flow analysis. We have developed many proprietary indicators based on our market experience and partner traders.
VolBook® is a professional volumetric trading platform and offers an innovative way to visualize and analyze market depth, level 2, without neglecting the study of level 1.we made a tremendous effort to build a lightweight, clear and functional proprietary heatmap.
Analyze Order Flow Analyzer, Volume Profile, Time and Sales and Orders with VolSysVolSys® is a professional trading platform whose main focus is Order Flow Analyzer, Volume Profile, Time & Sales and Order Flow analysis. We have developed many proprietary indicators based on our market experience and partner traders.
Use our unique and dedicated volumetric analysis tools!With Volumetrica, you have a whole arsenal of technologies at your disposal, designed to give you a deeper, more accurate and informed reading of the market.
All the ways to "read" inside a candle!With our platforms, you don't have to settle for just seeing the price. We offer a multitude of variations for viewing clusters, allowing you to look inside each individual bar.
The Market Analysis Revolution has Arrived! Let's put an end to compromise: with our platforms, you have a full arsenal of market analyzers at your disposal. From the most classic tools to those we have created exclusively, every single resource is available to you in a single, very powerful workspace.
Volume Charting
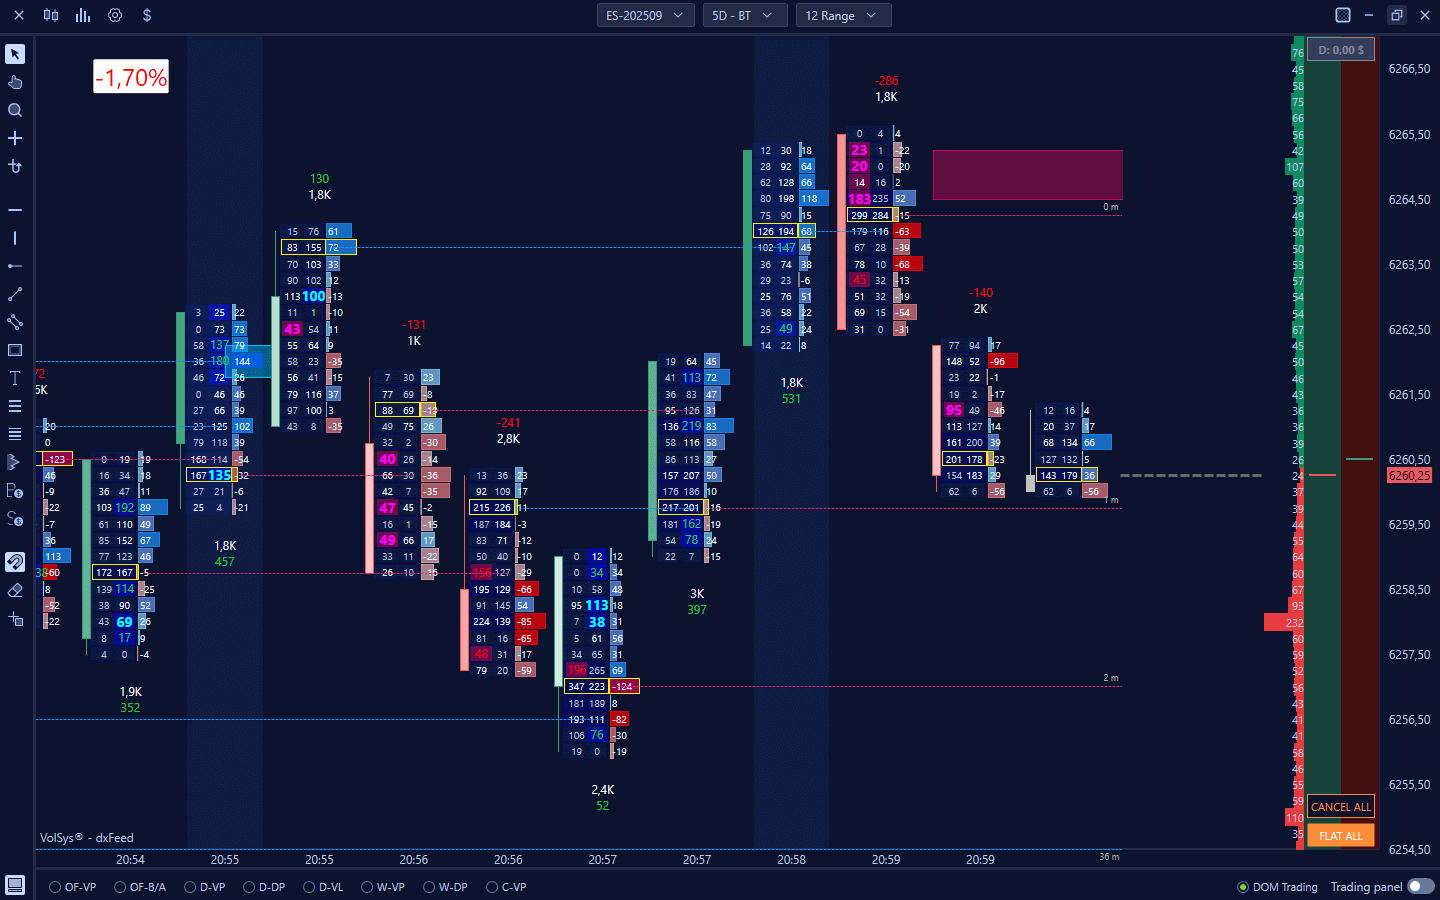
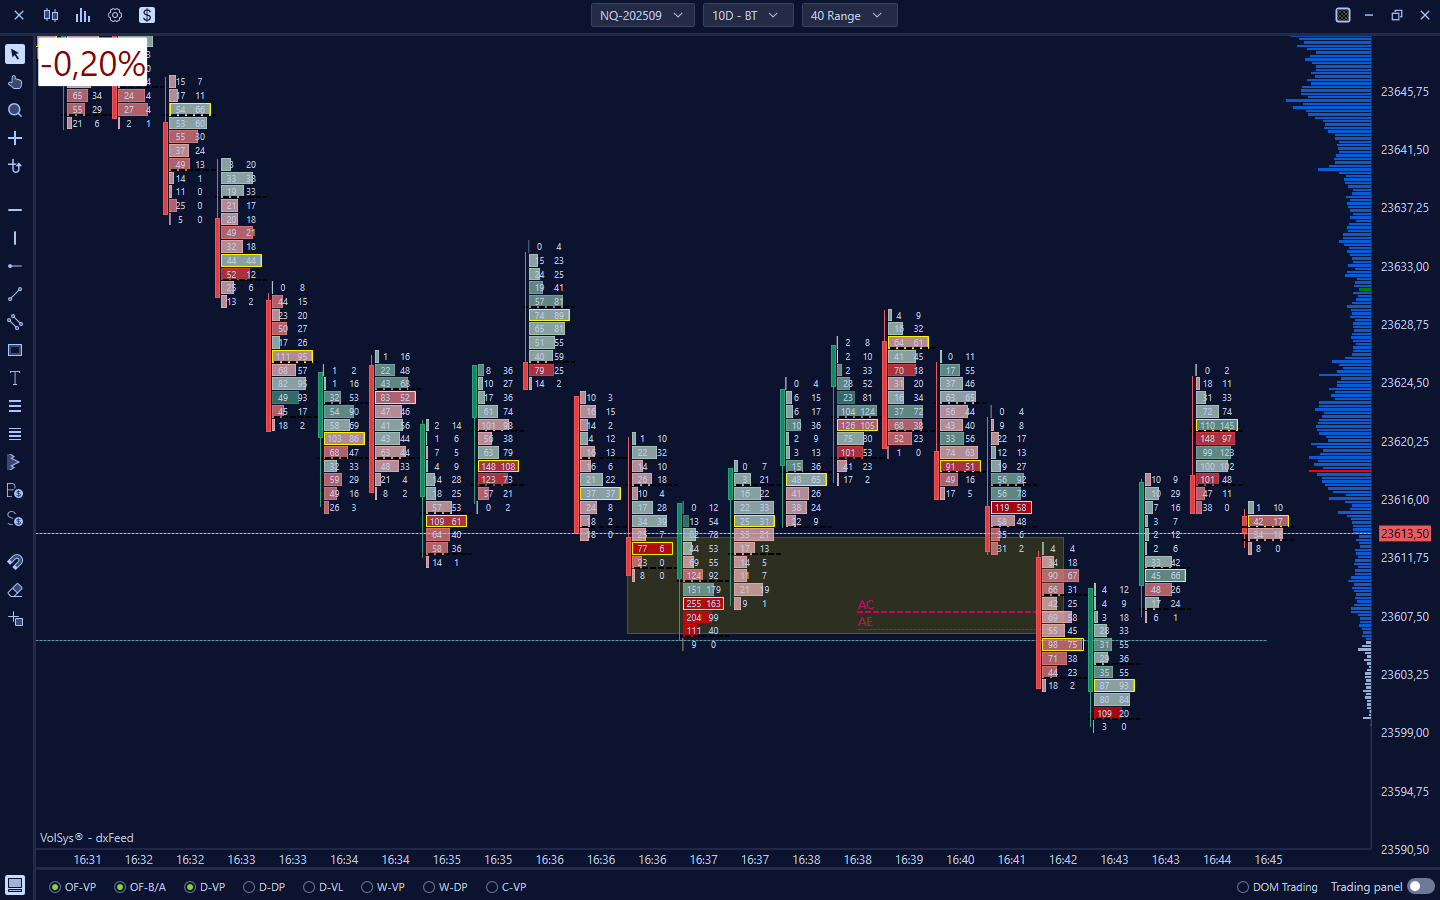
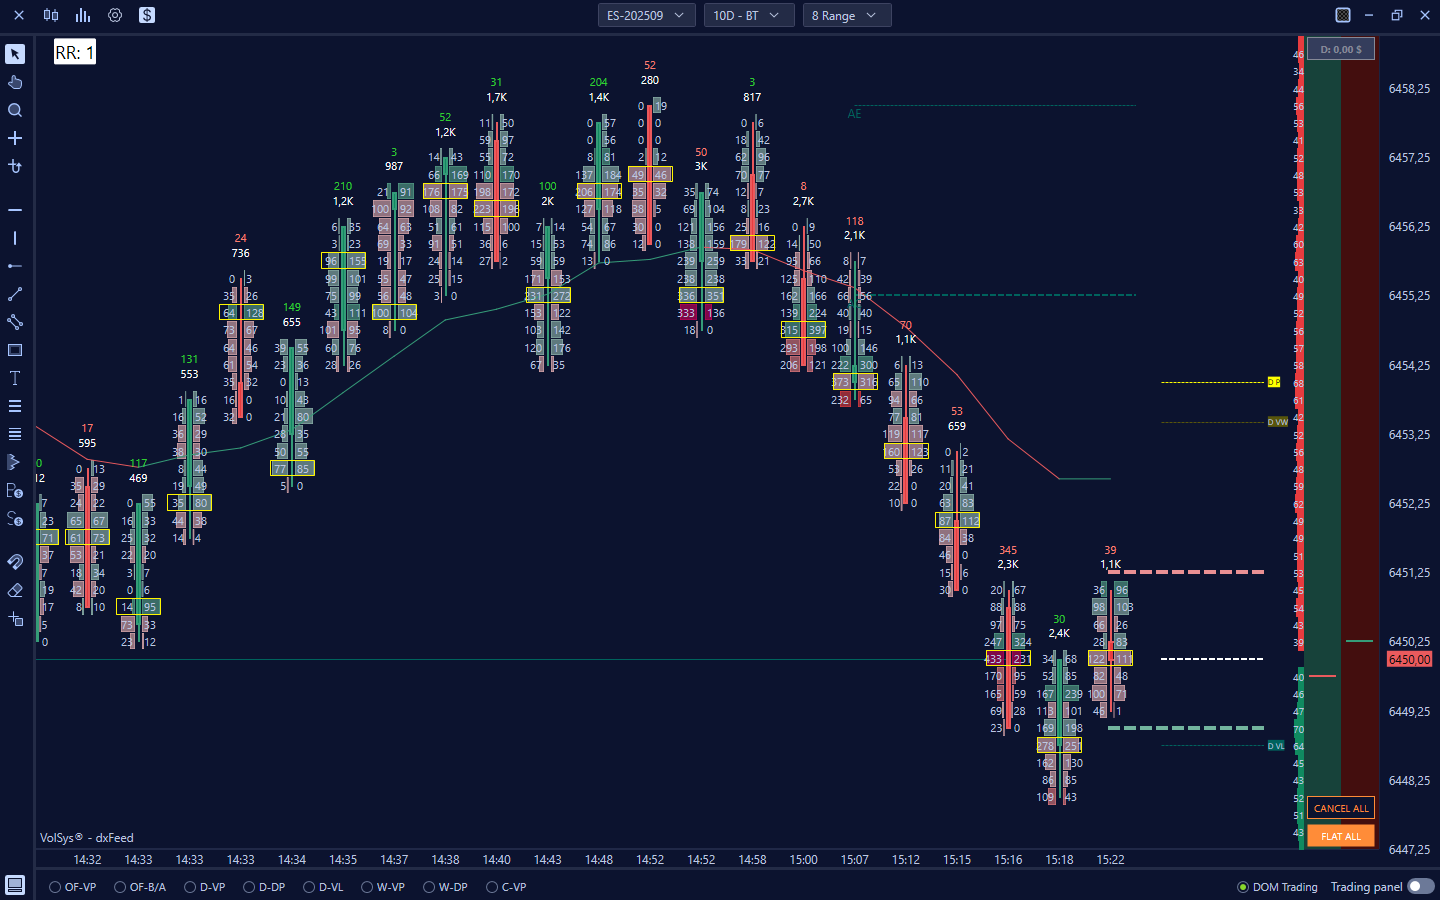
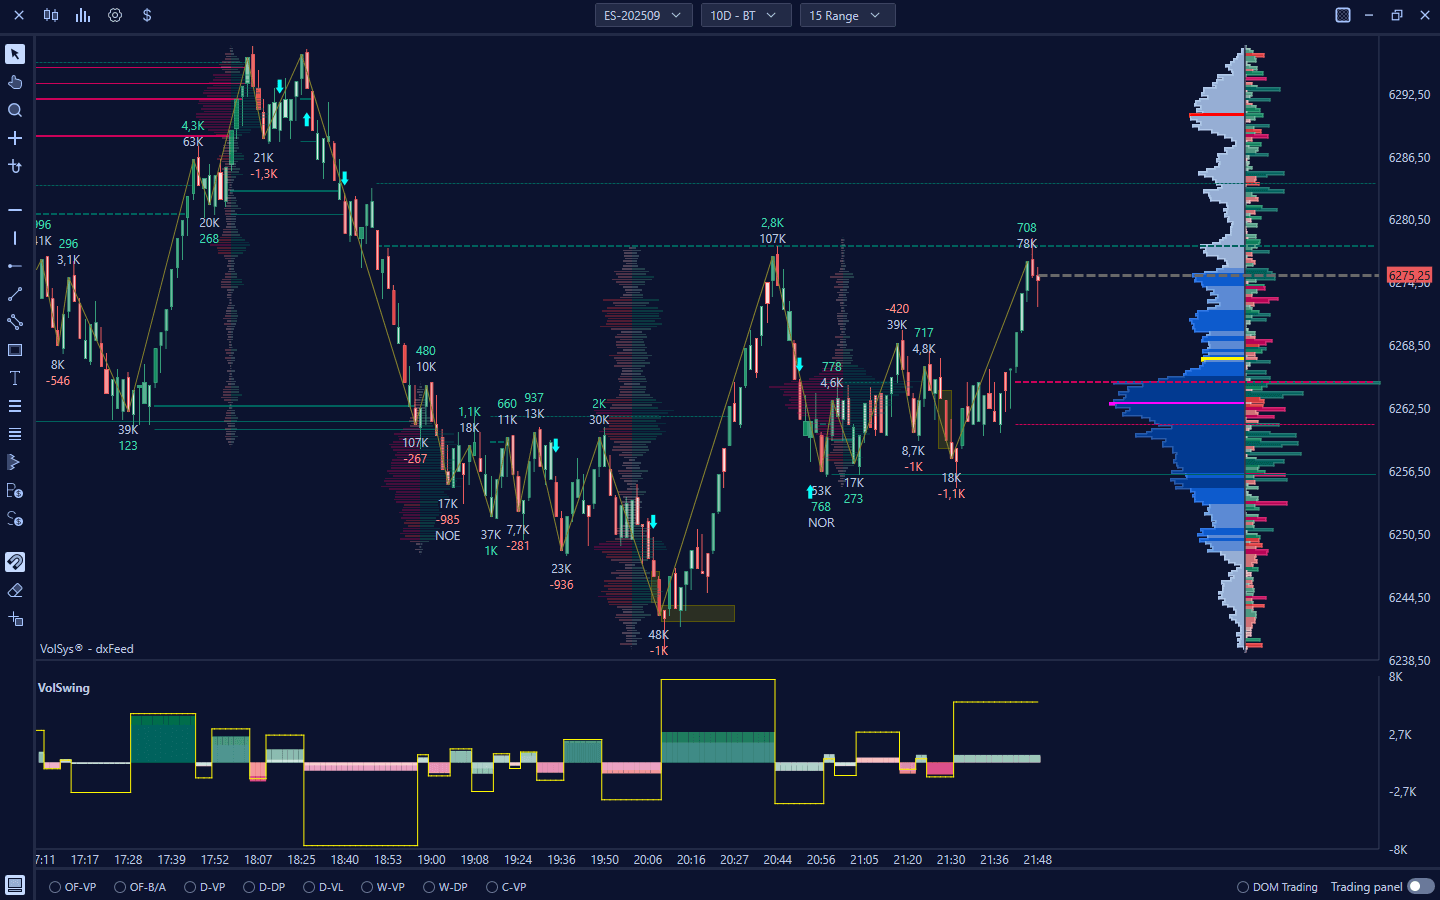
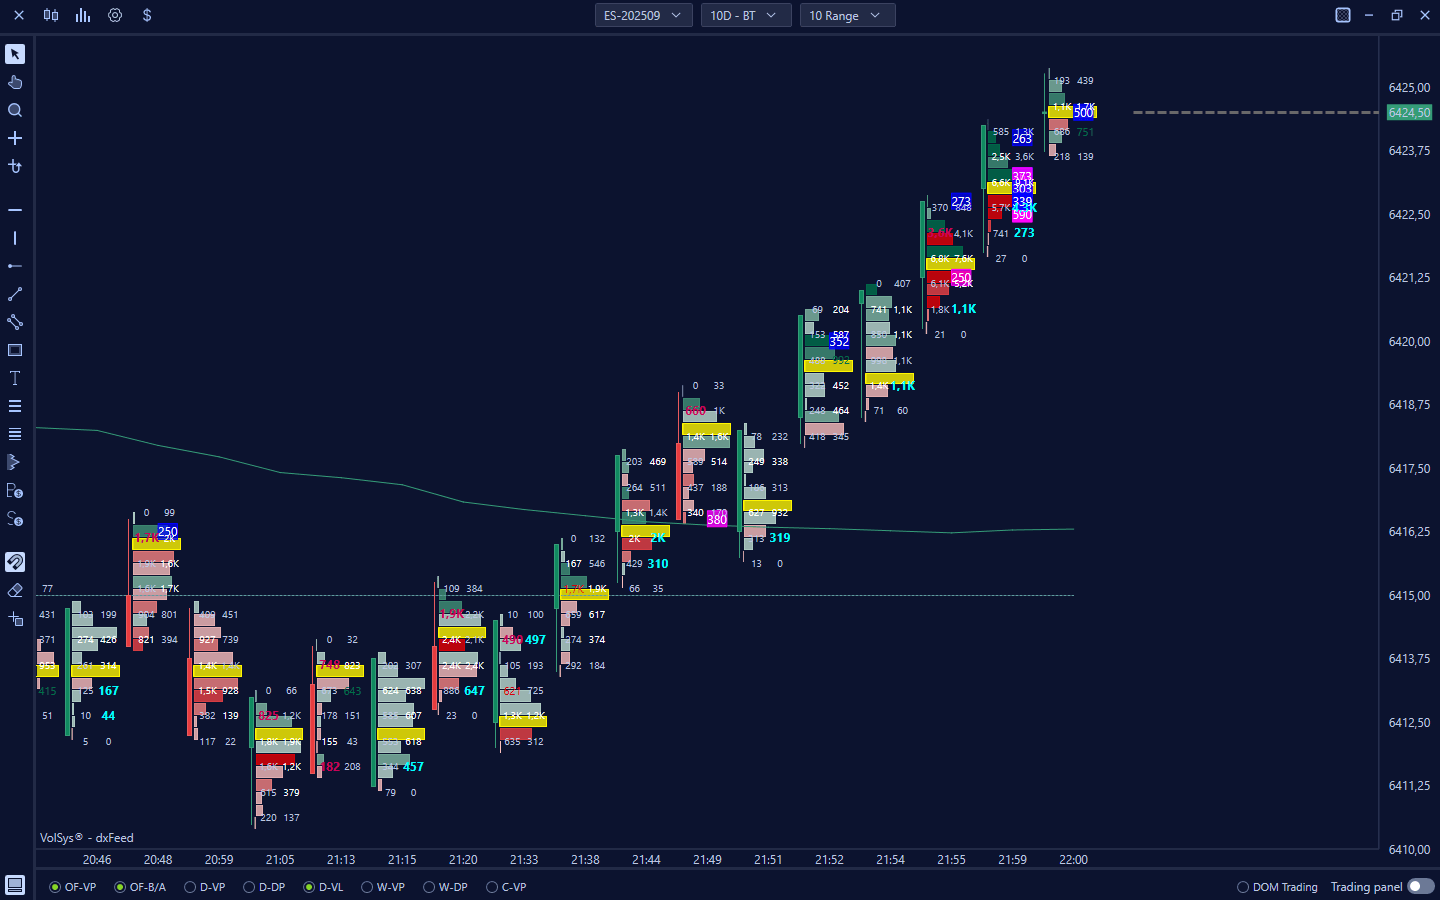
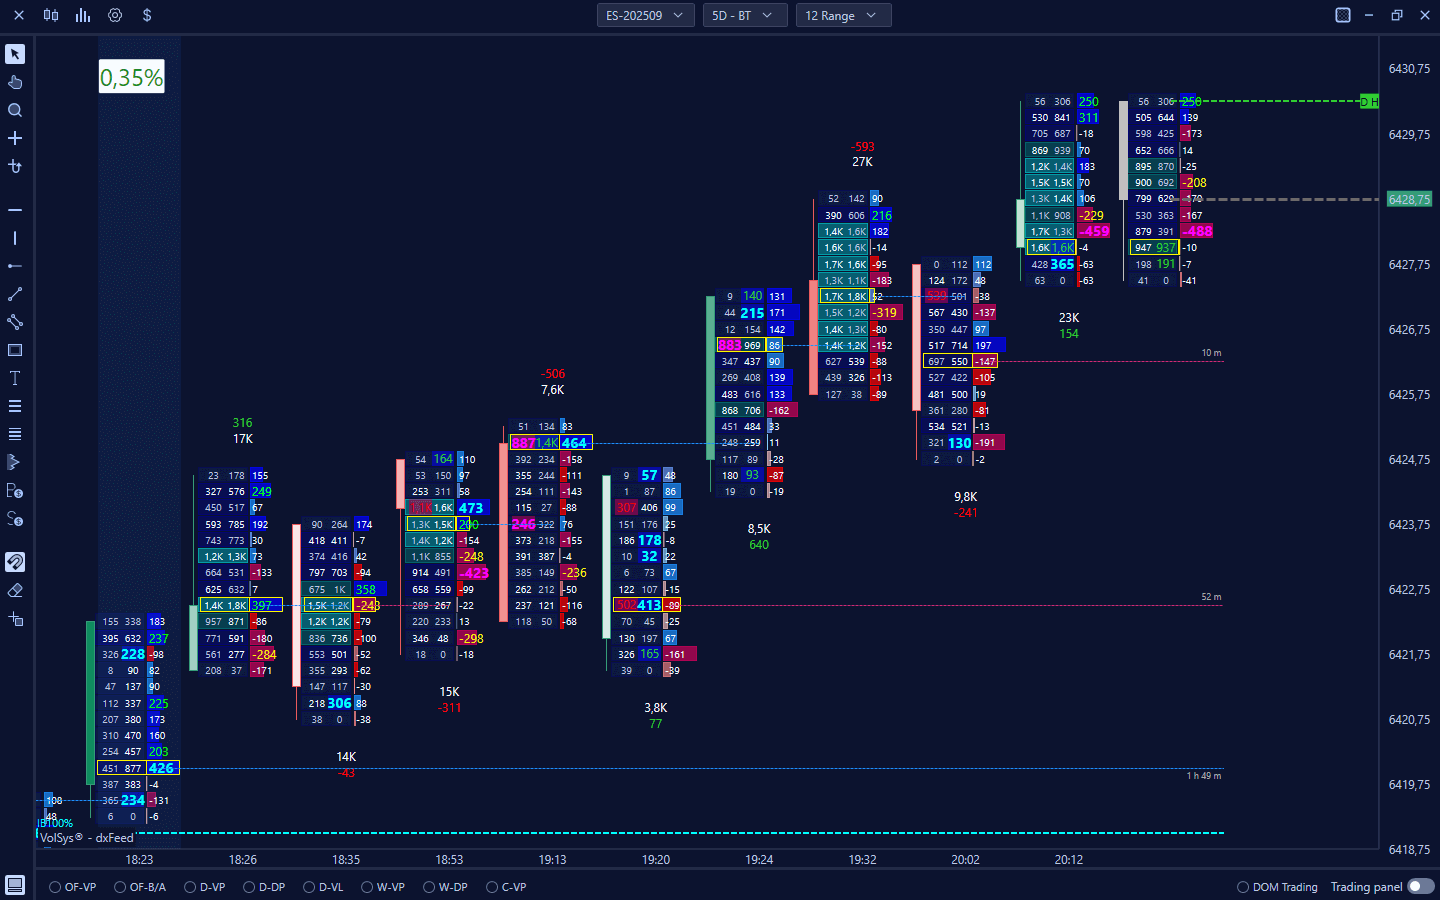
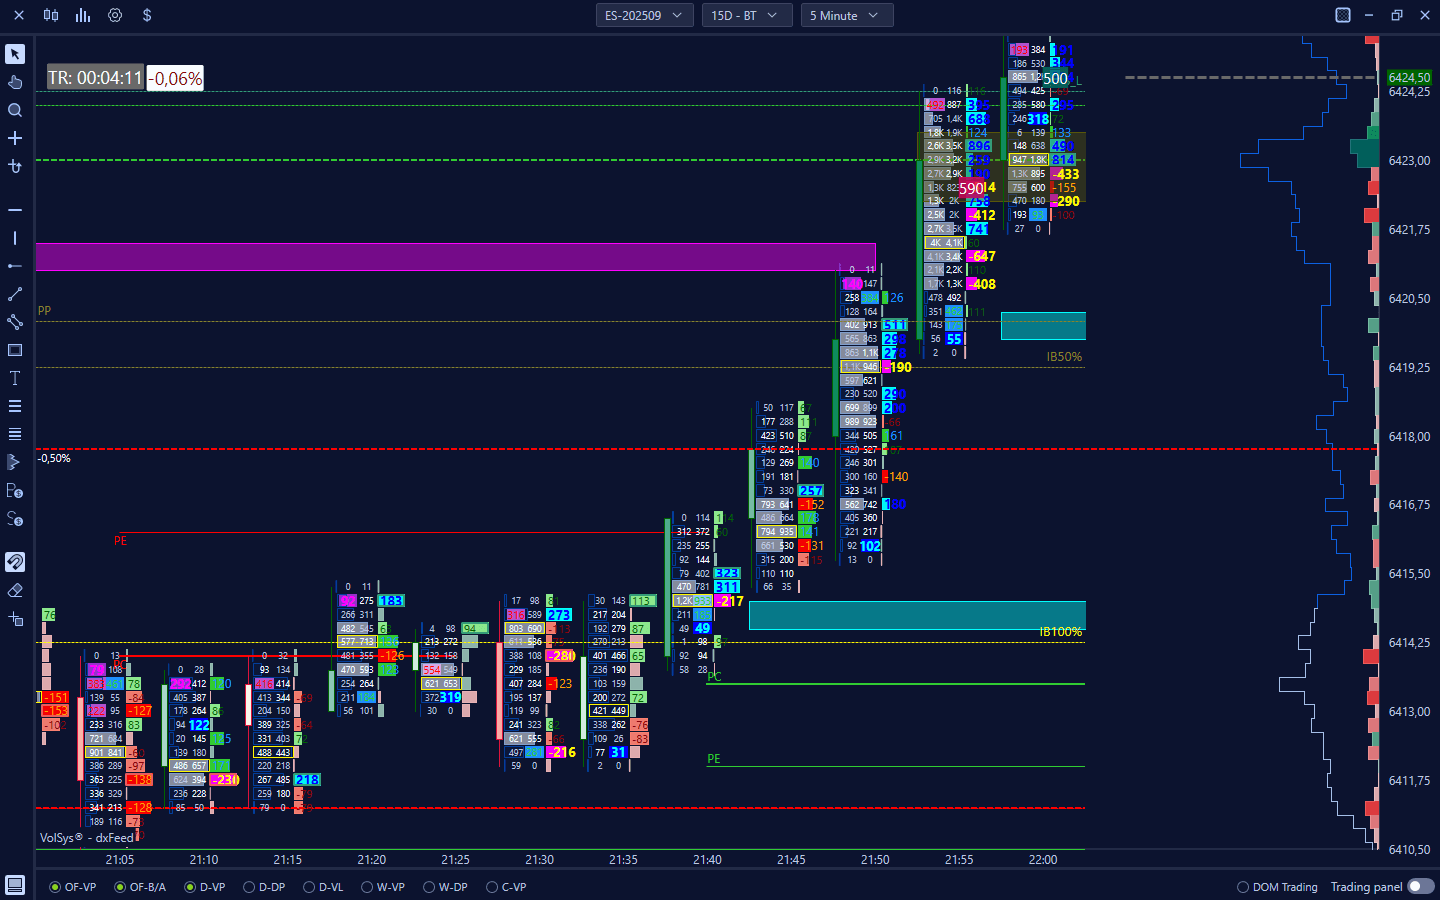
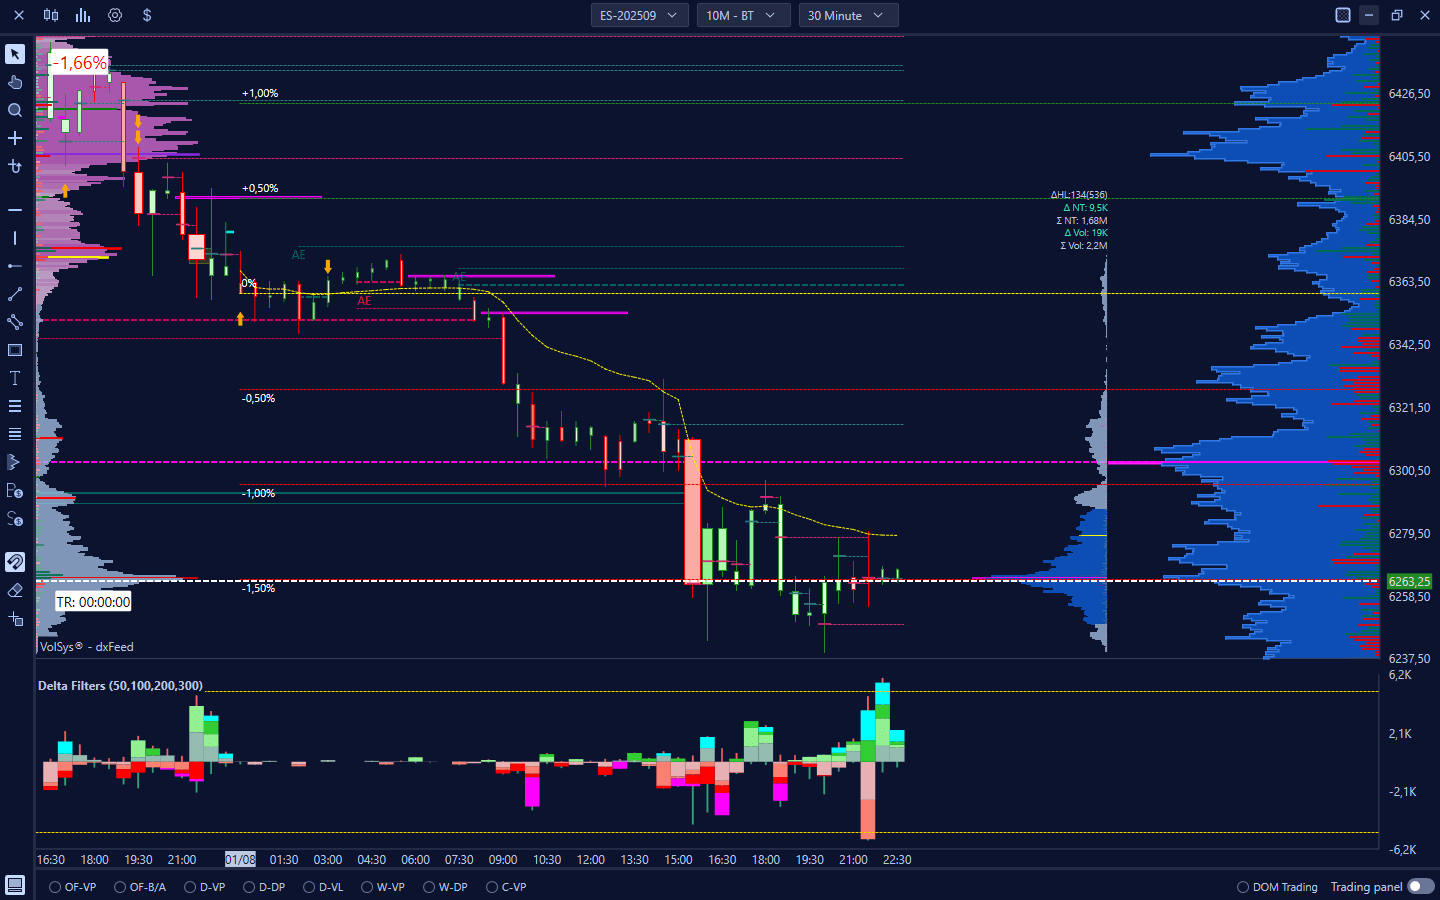
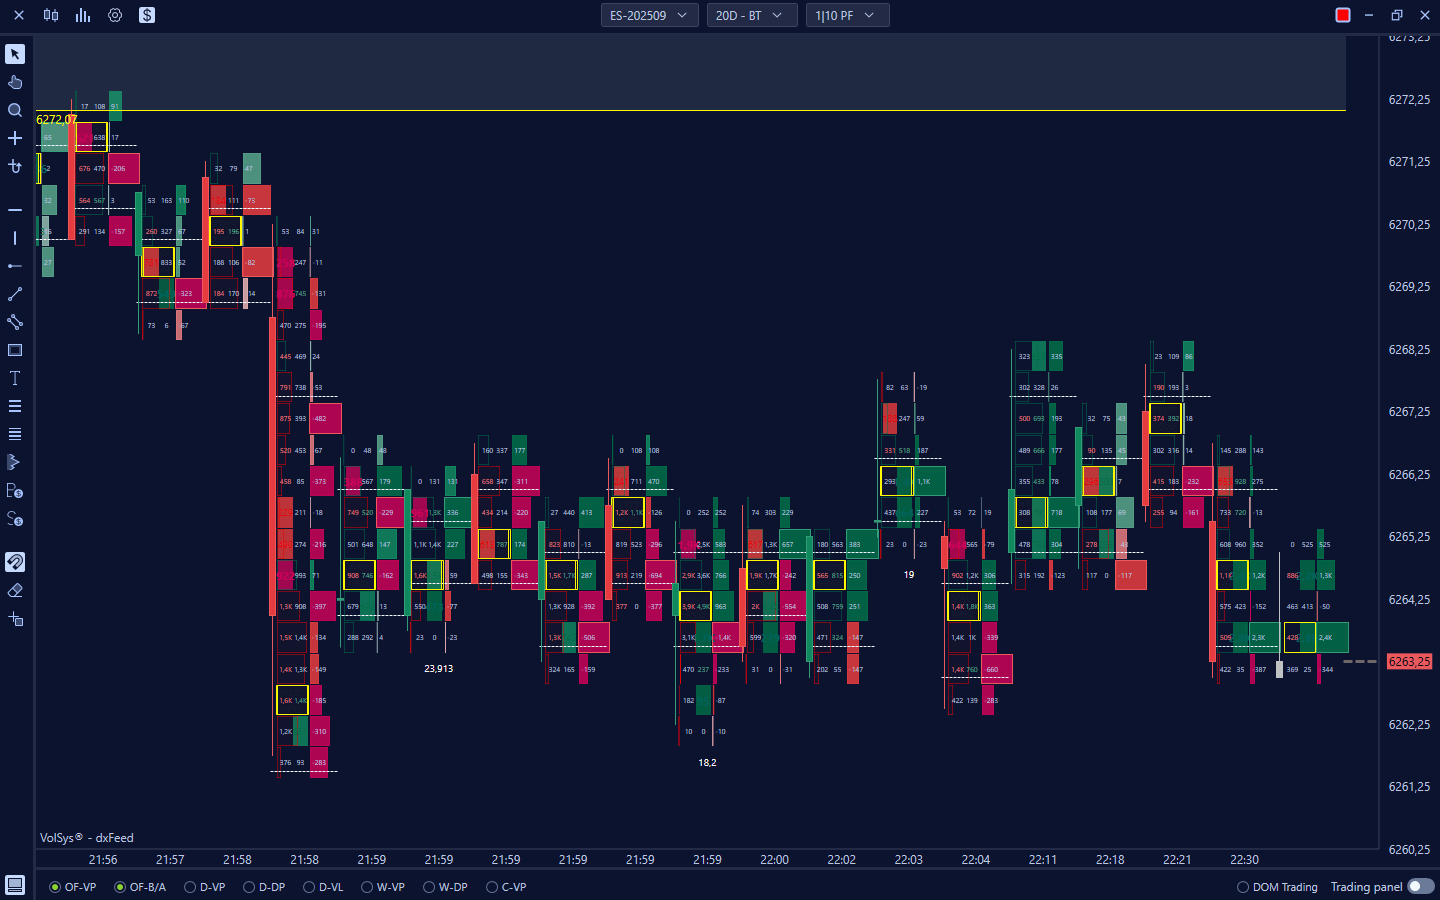
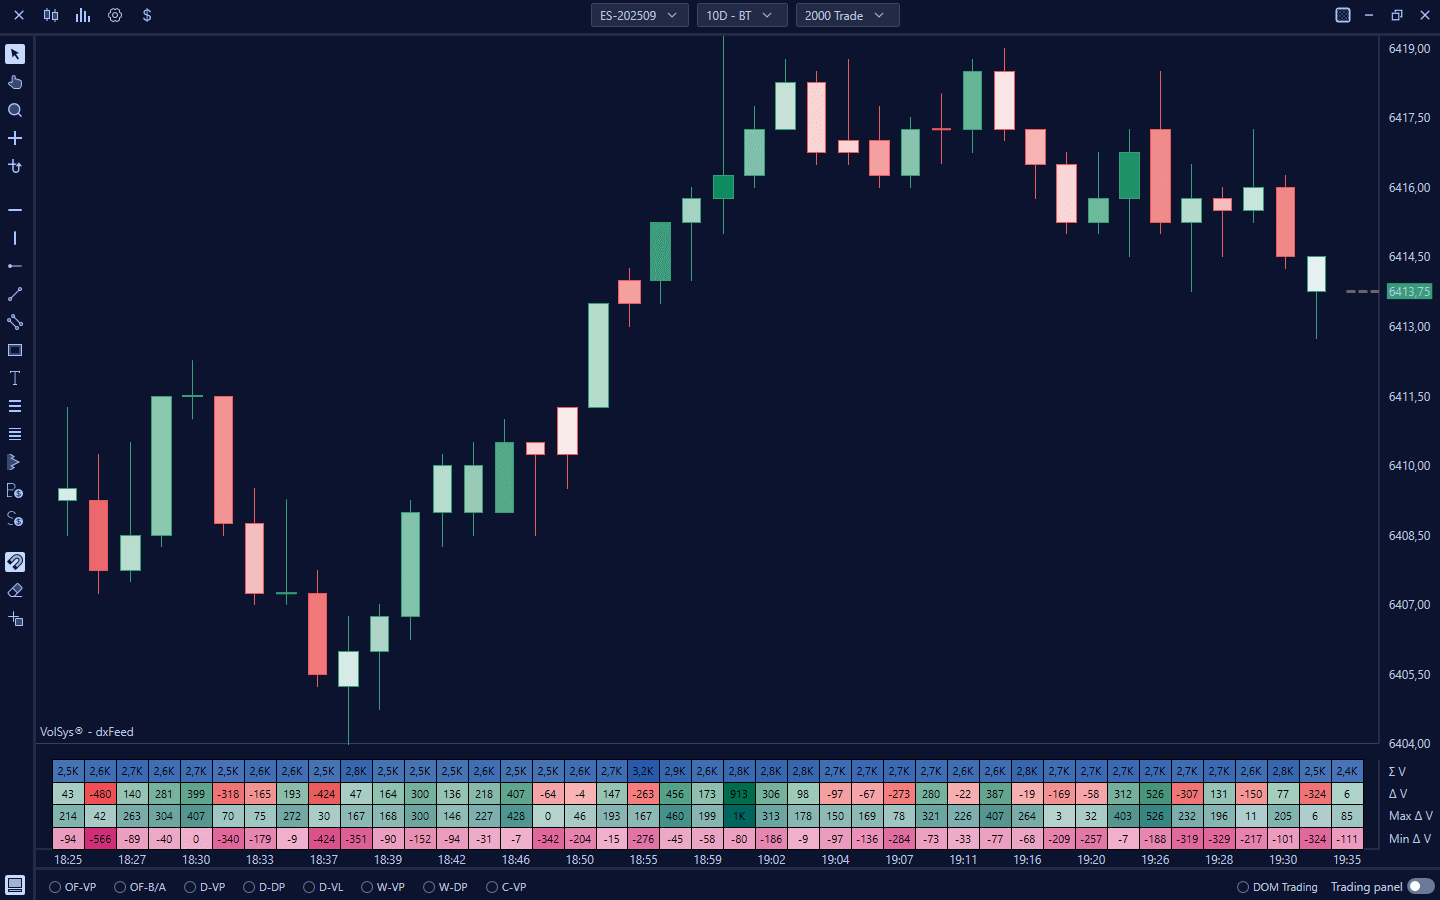
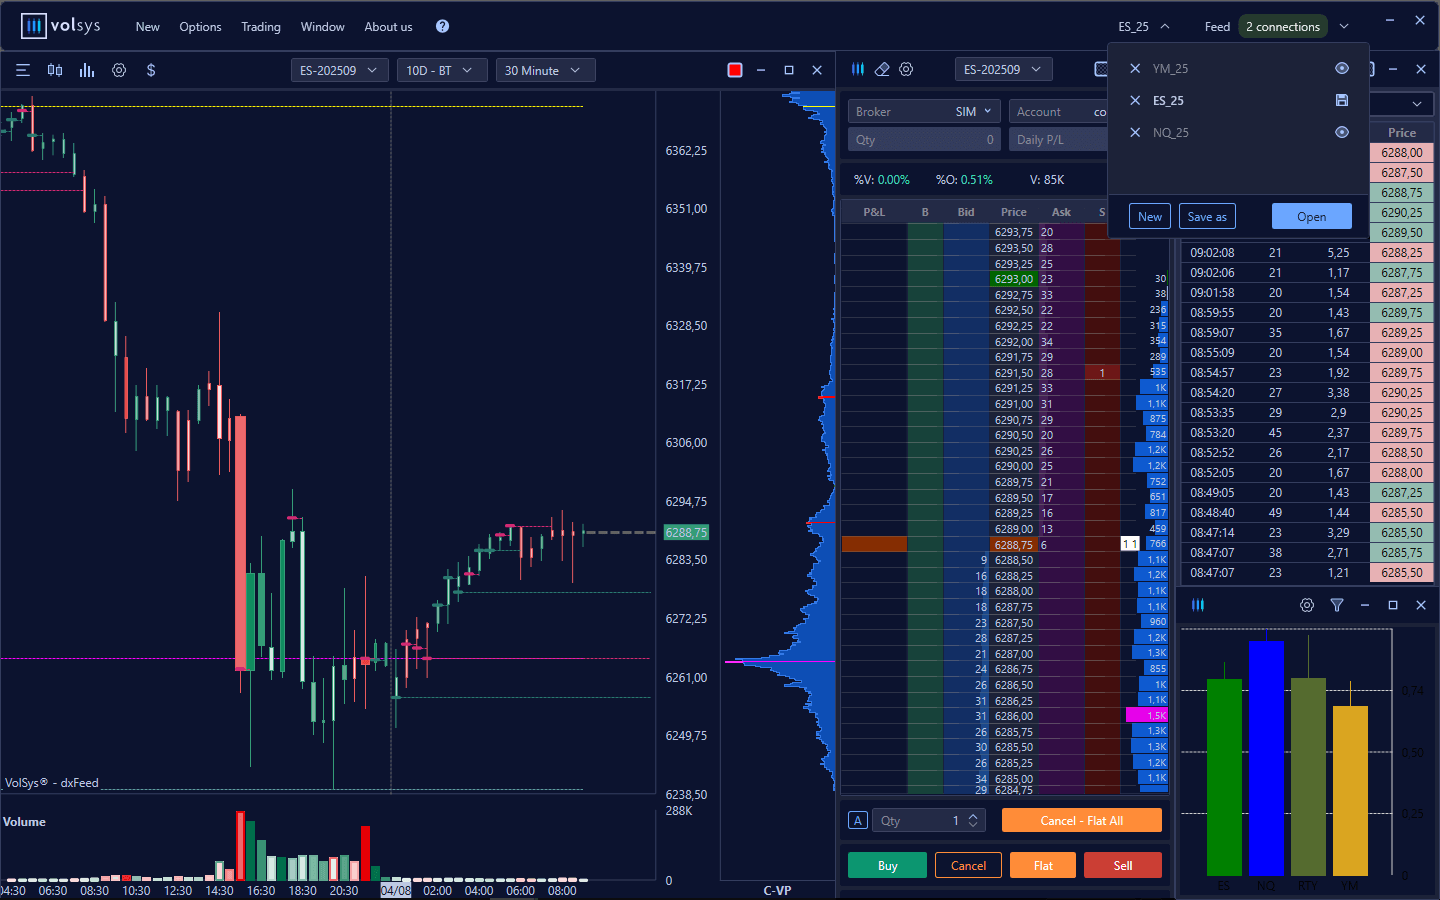
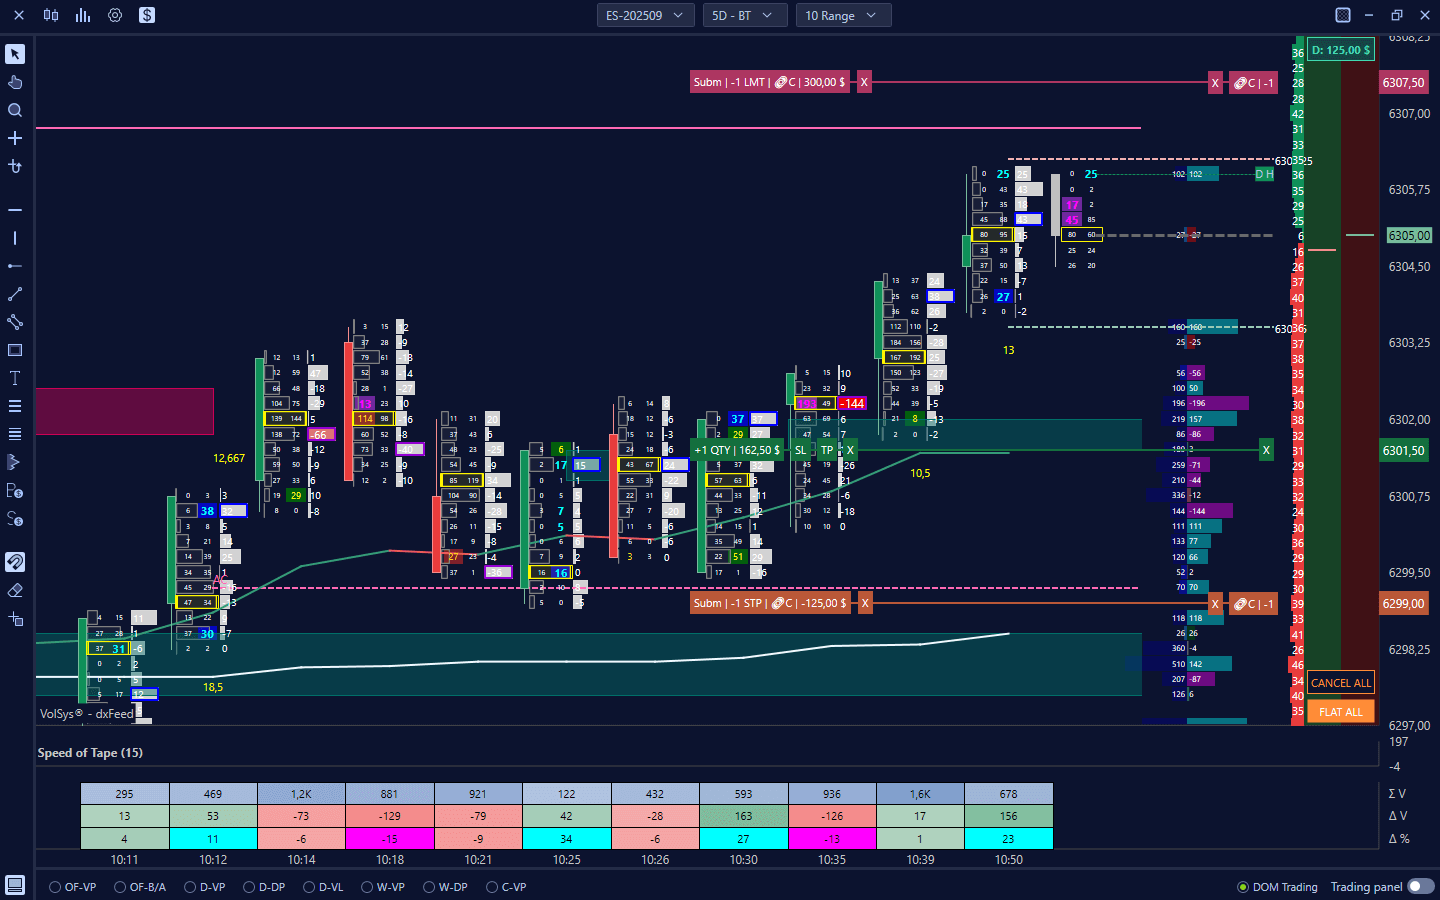
Order Flow AnalyzerThe Order Flow Analyzer from VolSys stands as an absolutely fundamental tool in volumetric analysis, standing out for its revolutionary ability to provide detailed and deep market insight. This powerful indicator uniquely combines price, trade volume, and order flow within a single bar, turning complex data into clear, actionable information.
With VolSys' Order Flow Analyzer, you will have the ability to identify with surgical precision critical market moments such as buyer/seller accelerations (a sign of increasing directional aggressiveness), absorptions (when one part of the market neutralizes the opposite aggressiveness, indicating potential reversals), exhaustions (signs of weakening of a move), and any BID/ASK denominations for each individual price tick. This granularity of detail is unparalleled for understanding the true intentions of traders.
The strength of the Order Flow Analyzer also lies in its complete customization: you can choose to view total volume, Delta volume (the difference between buy and sell volumes), or Bid/Ask volume, tailoring the visualization to your specific analytical needs. This tool radically transforms the way you interact with the market, giving you a decisive competitive advantage. Start now
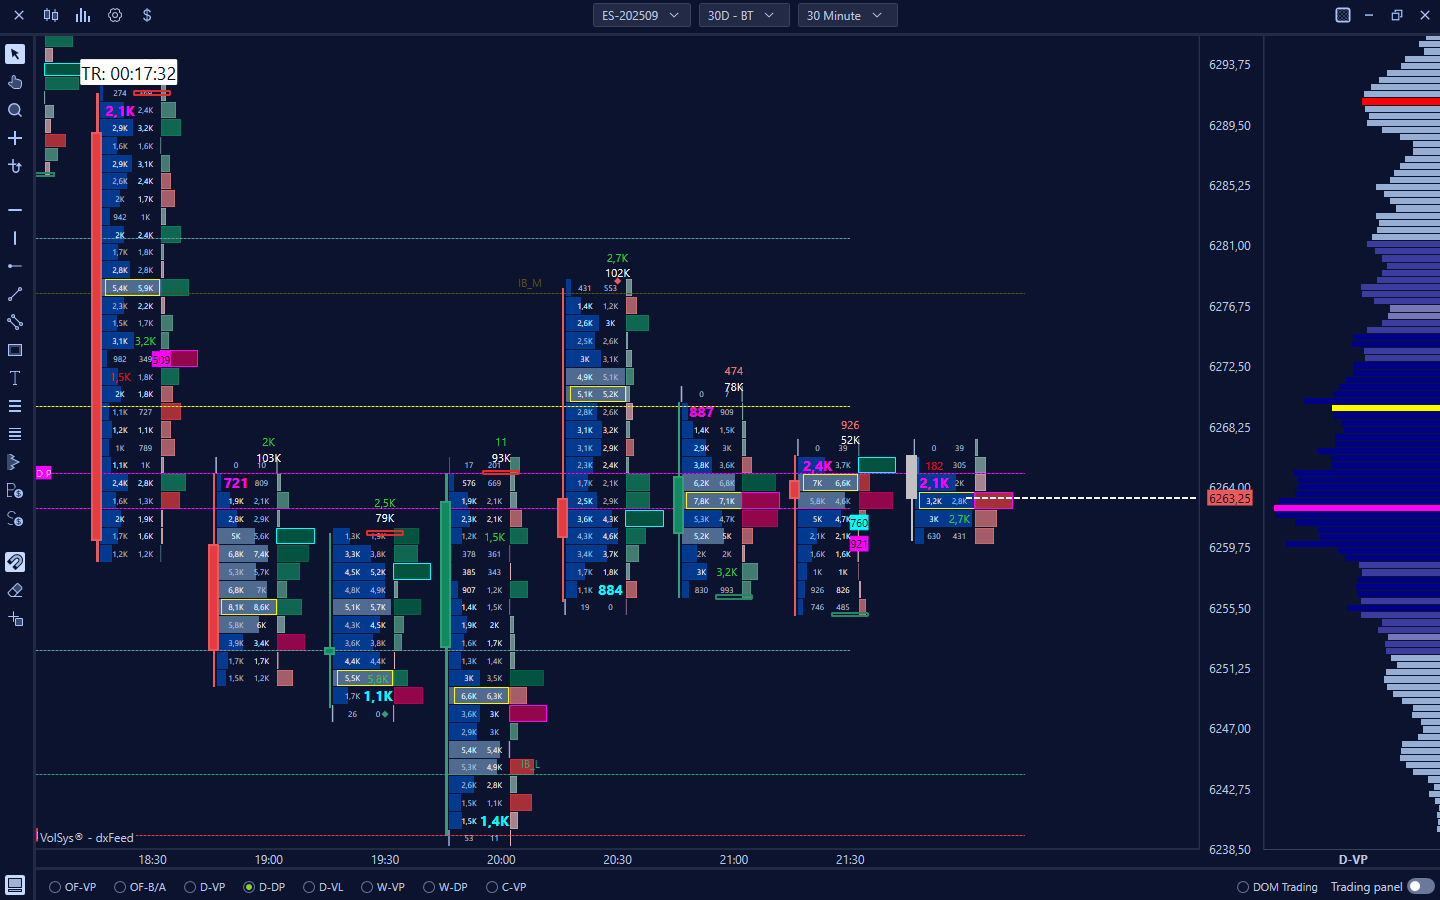
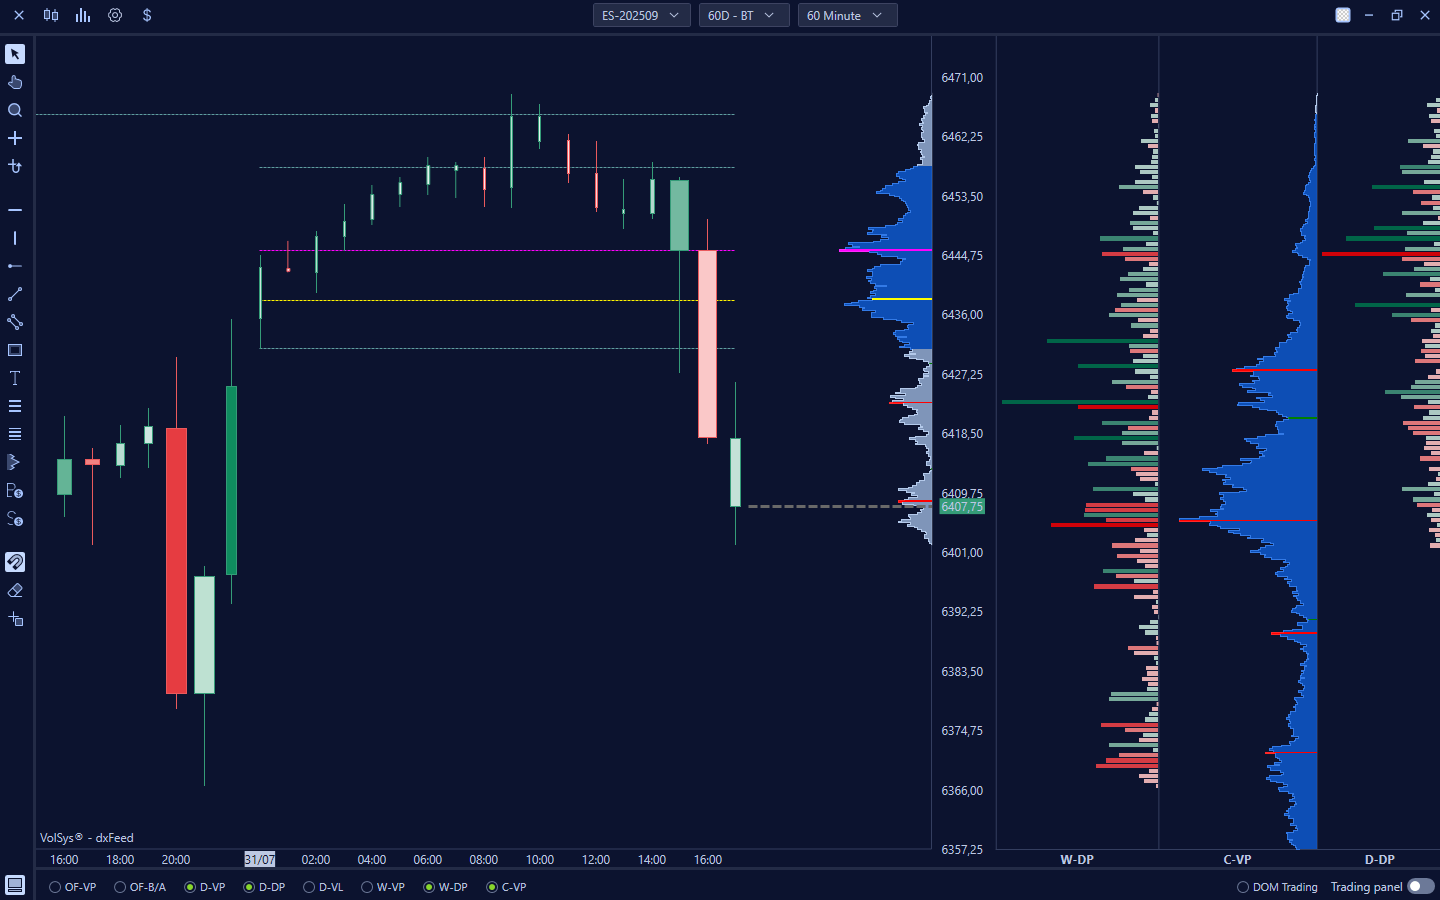
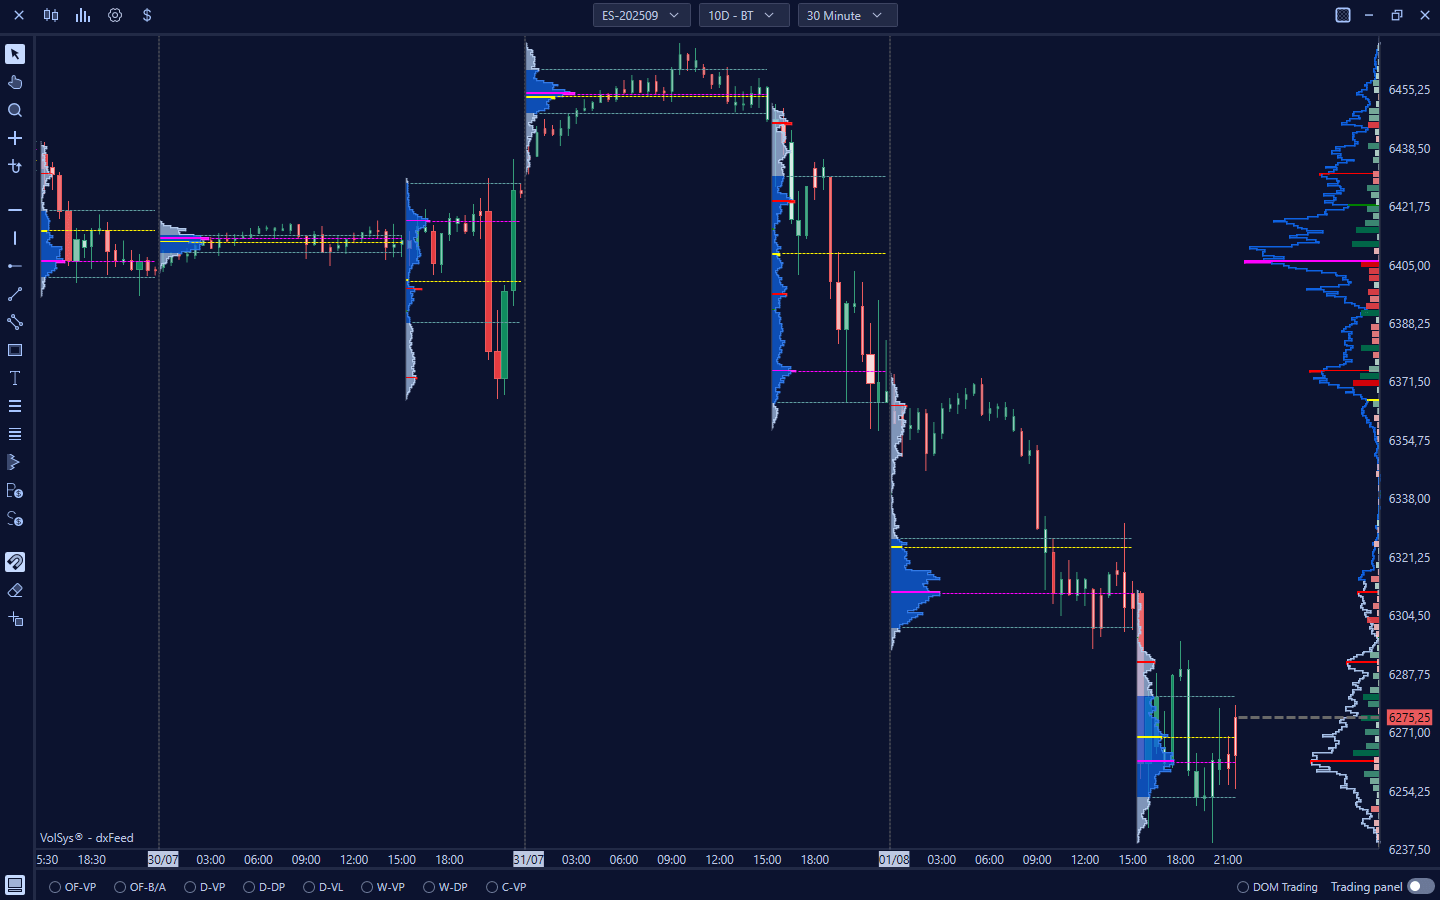
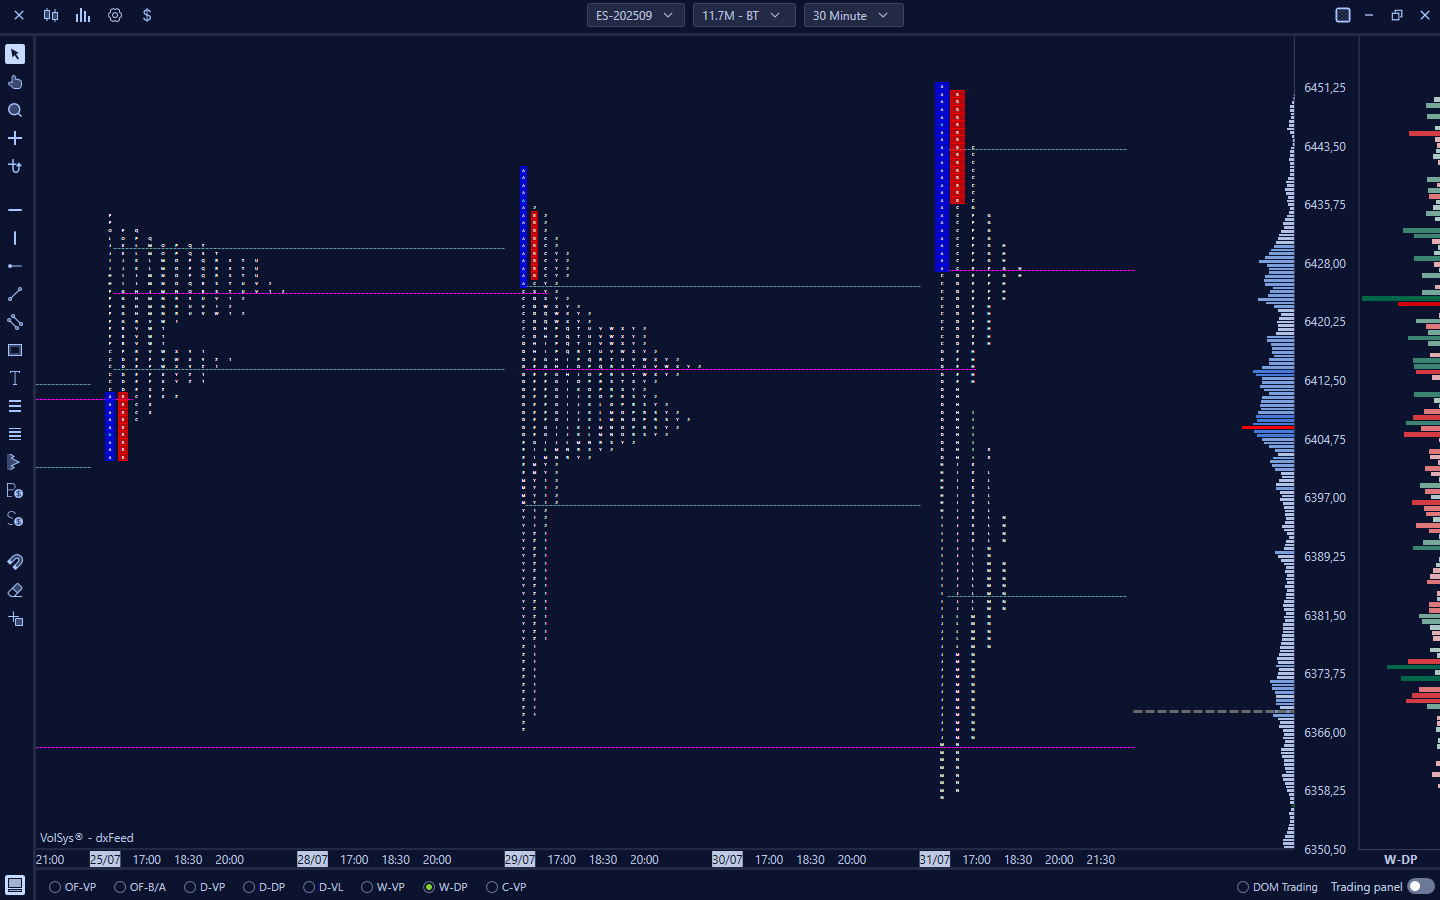
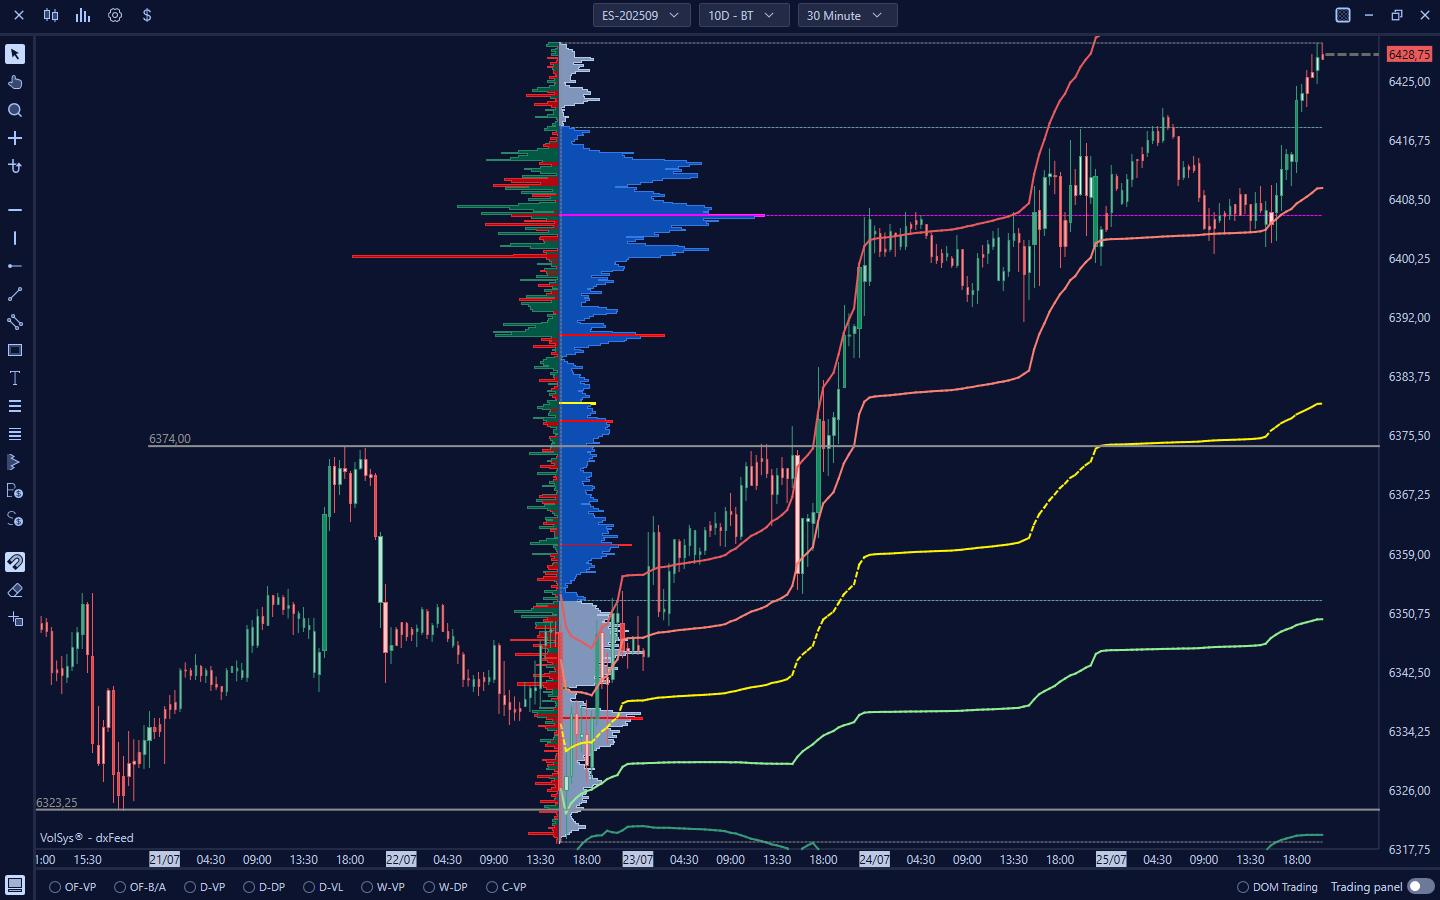
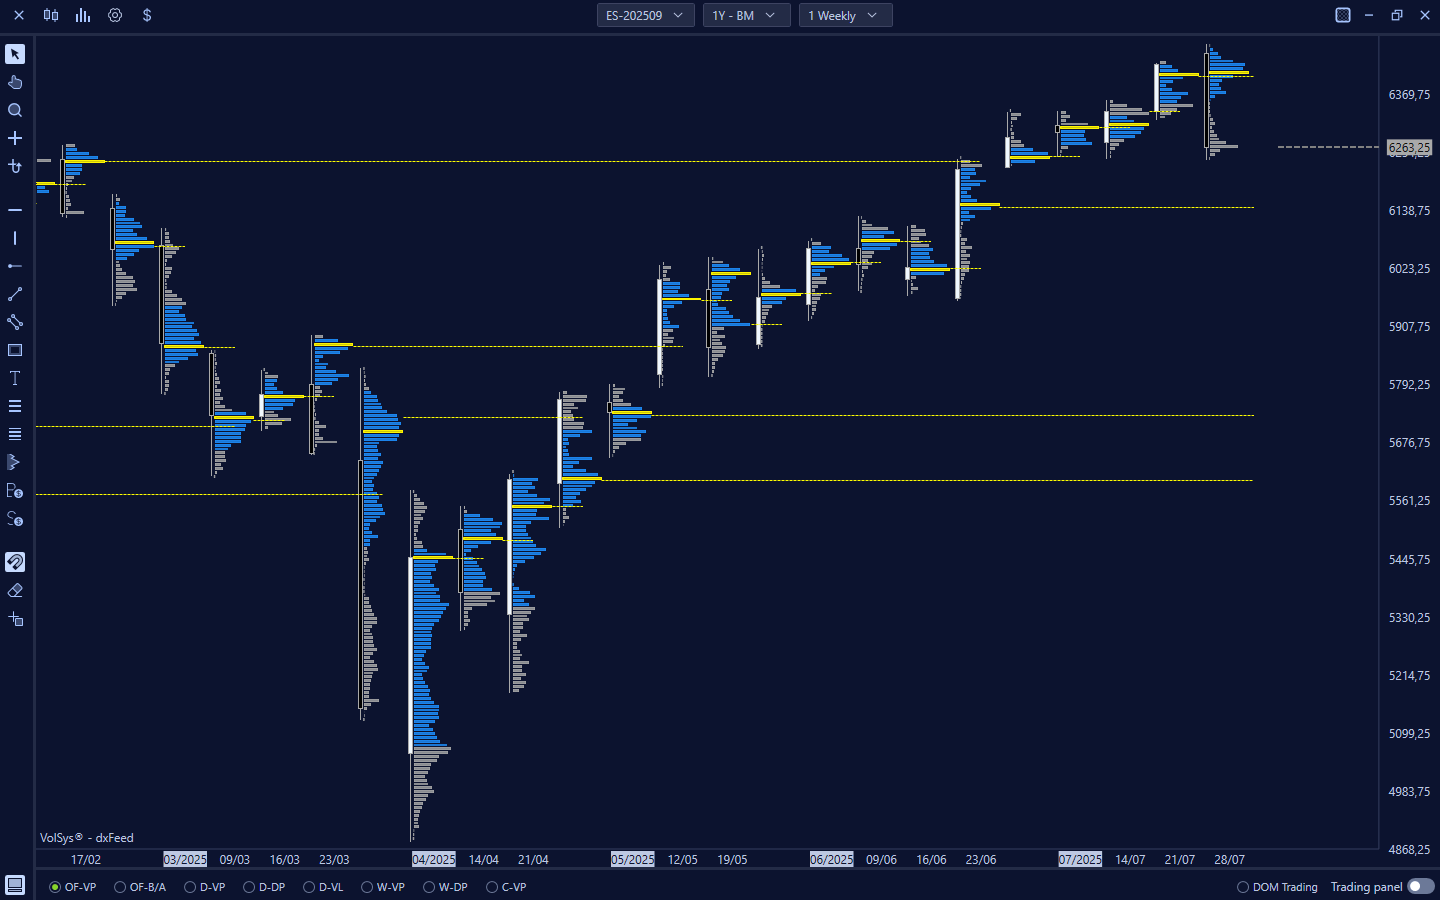
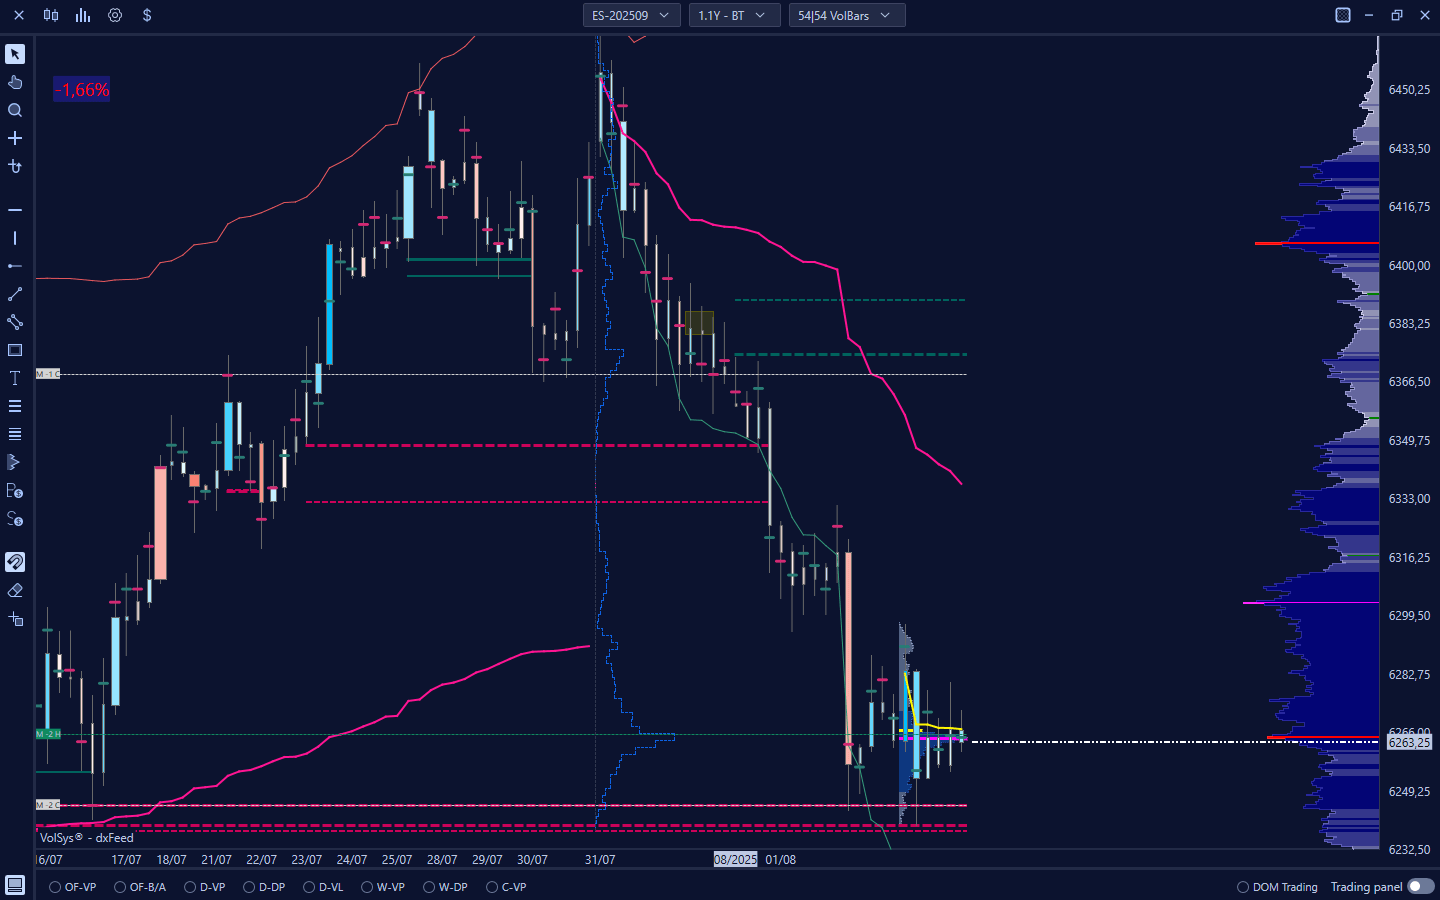
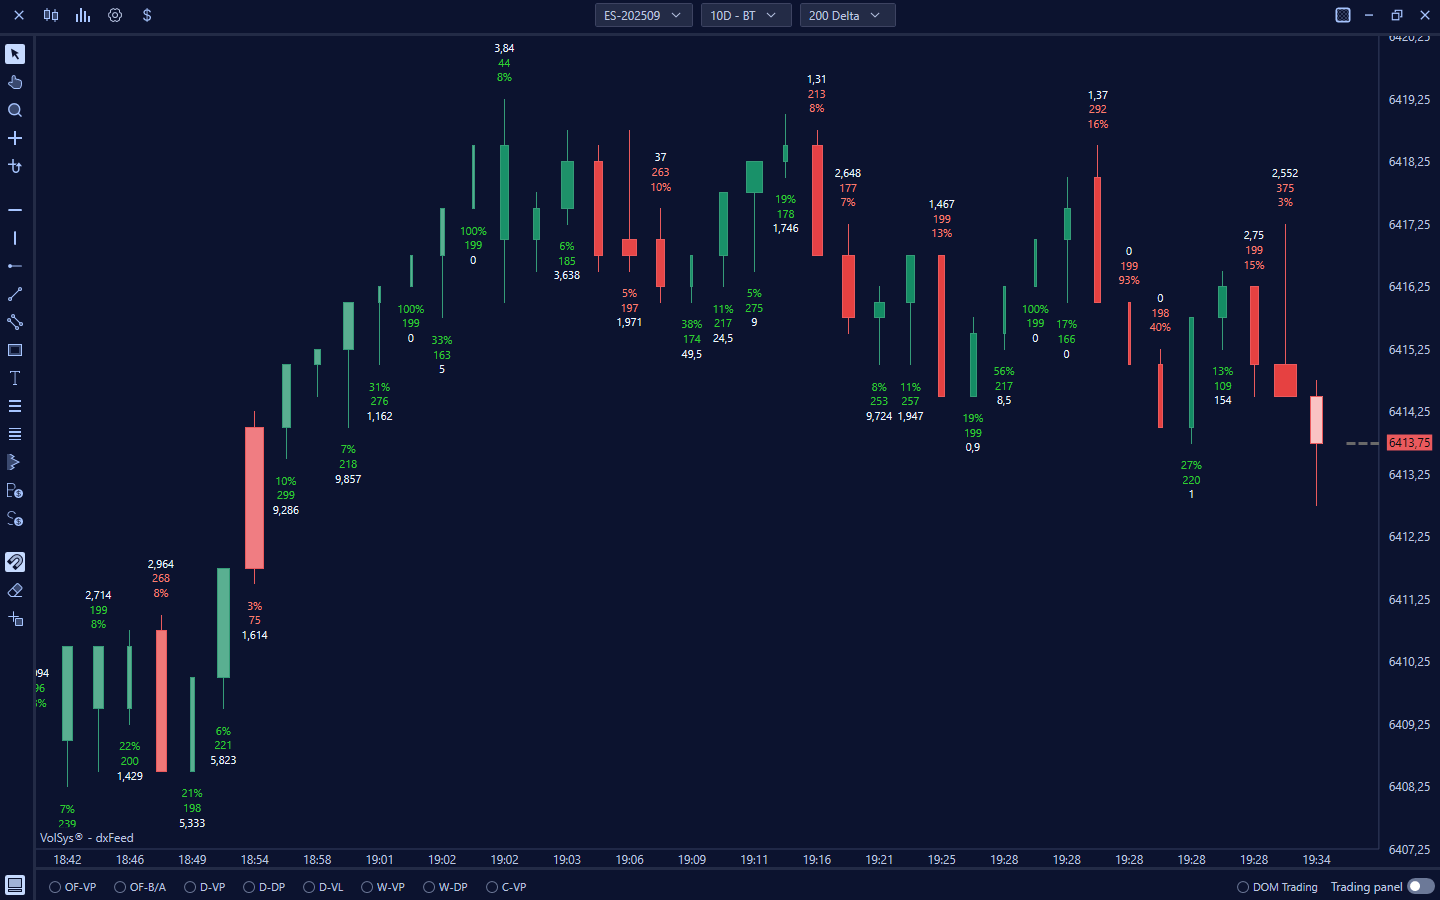
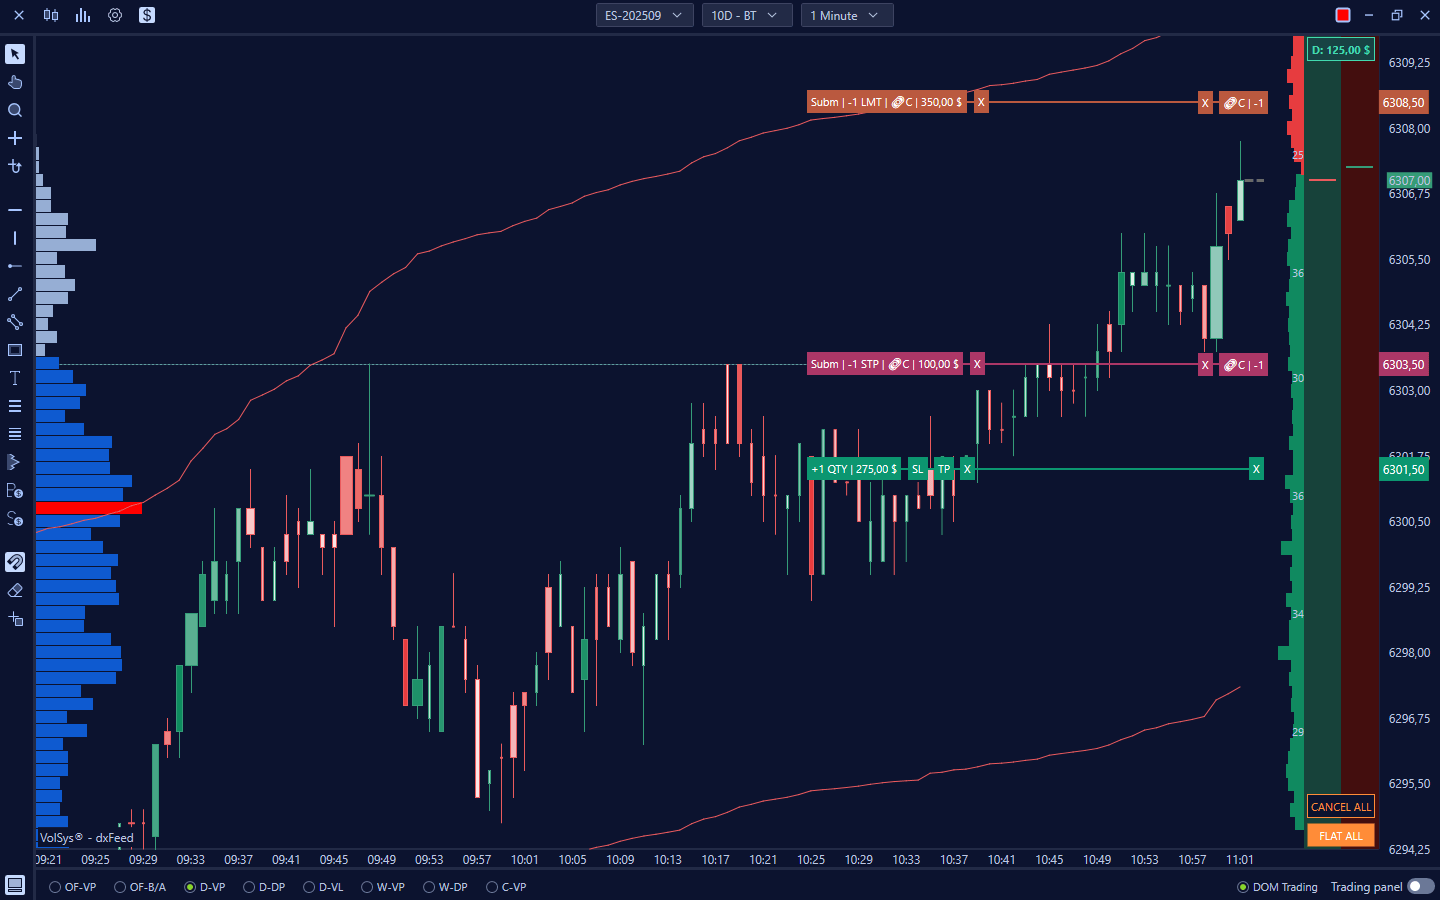
Volume and Delta ProfileThe Volume Profile is an indicator that displays the total volume traded at each price level in a given period. It is critical for understanding where trades were concentrated. It allows us to identify: Point of Control (POC): The price level with the highest volume. Value Area (VA): The price range where most volume was traded (e.g., 70%). High Volume Node (HVN): Significant volume peaks. Low Volume Node (LVN): Volume valleys, indicating low activity. VWAP (Volume Weighted Average Price): The volume-weighted average price. These elements provide a clear view of market activity and key support/resistance levels. The Delta Profile is an indicator that is added to the Volume Profile, showing the difference between the volume of buy orders and sell orders at each price level. While the Volume Profile highlights the total volume traded, the Delta Profile reveals its composition, indicating whether at a certain price there was more aggressiveness on the part of buyers (positive delta) or sellers (negative delta). With the ability also to split RTH-ETH sessions, allowing more granular analysis of volume and delta dynamics between regular and extended trading hours. Start now
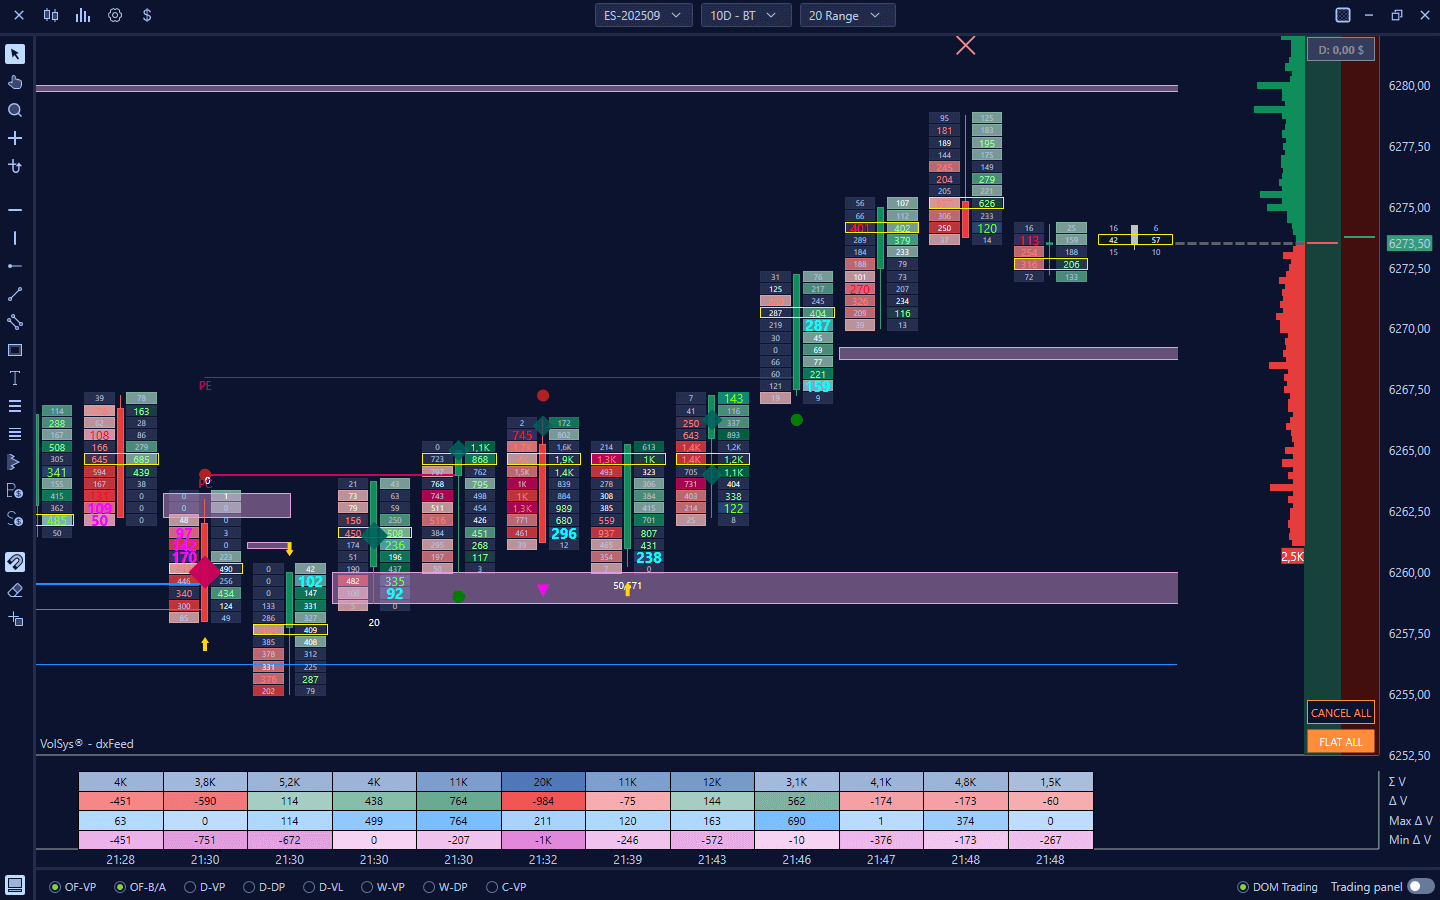
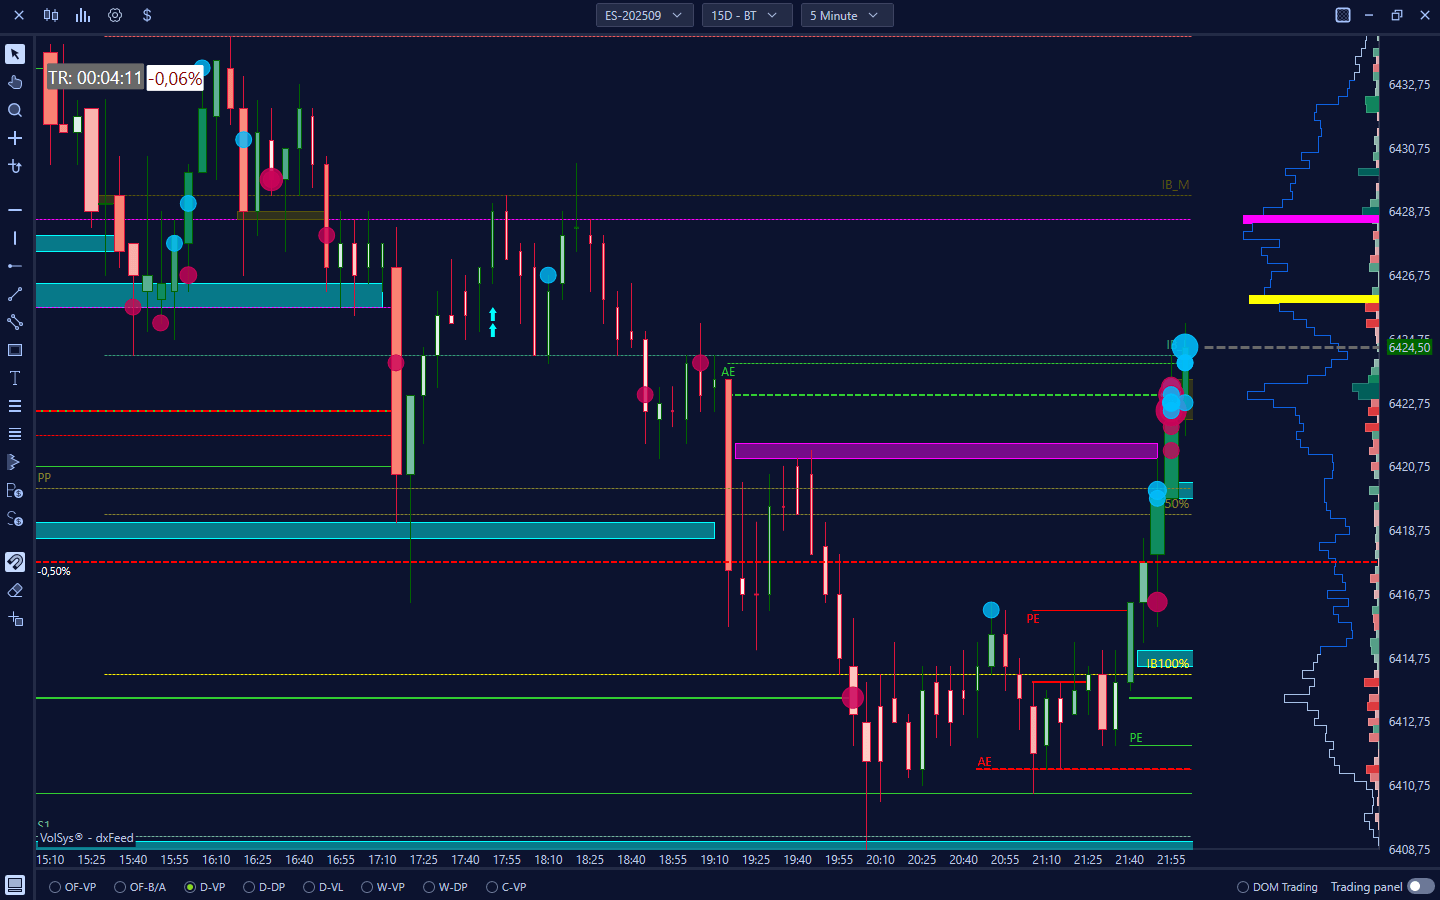
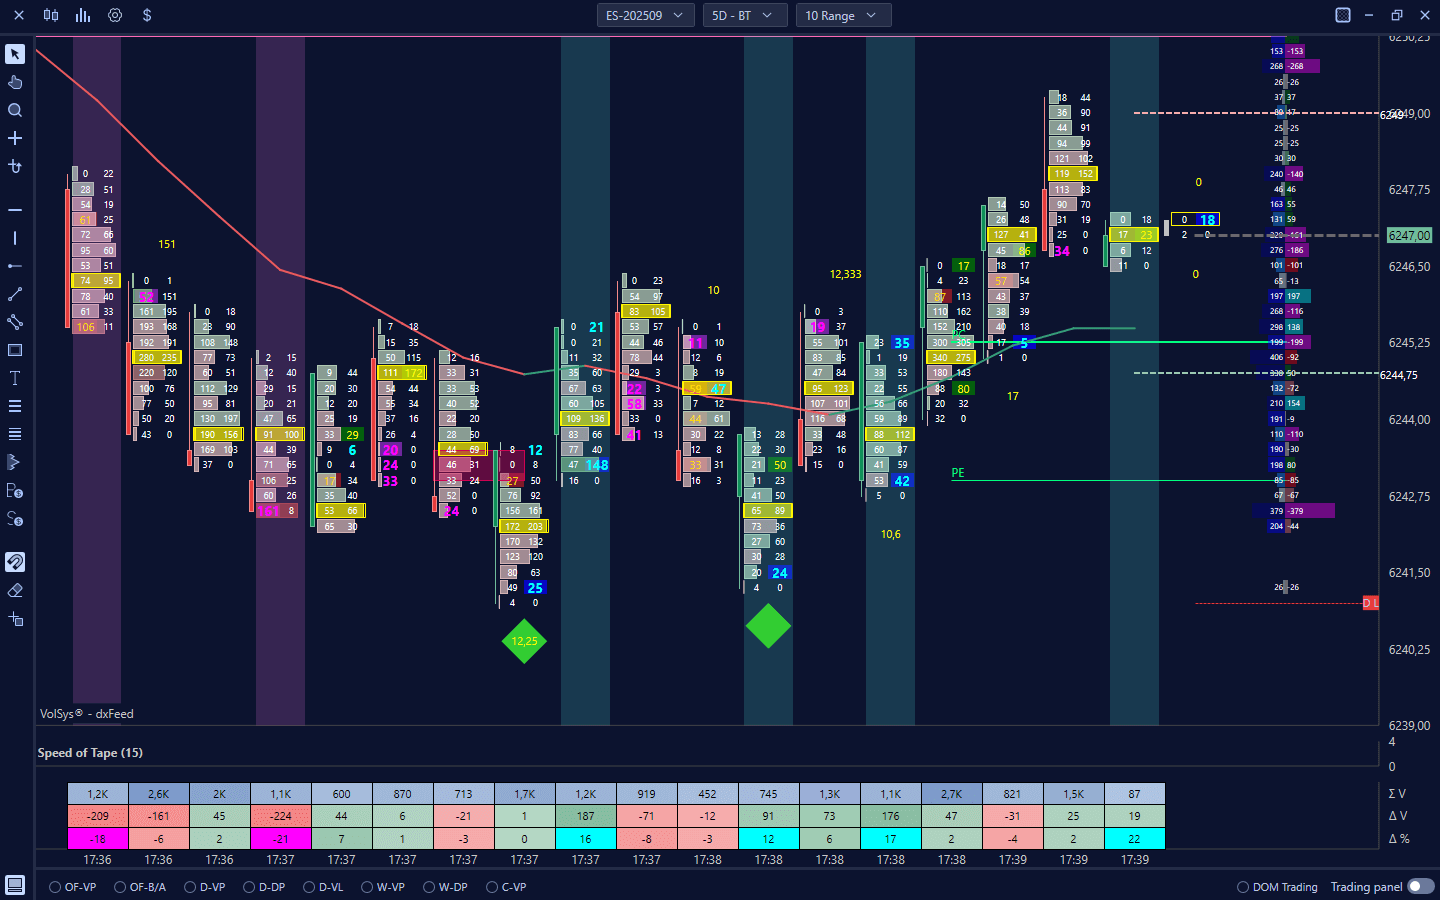
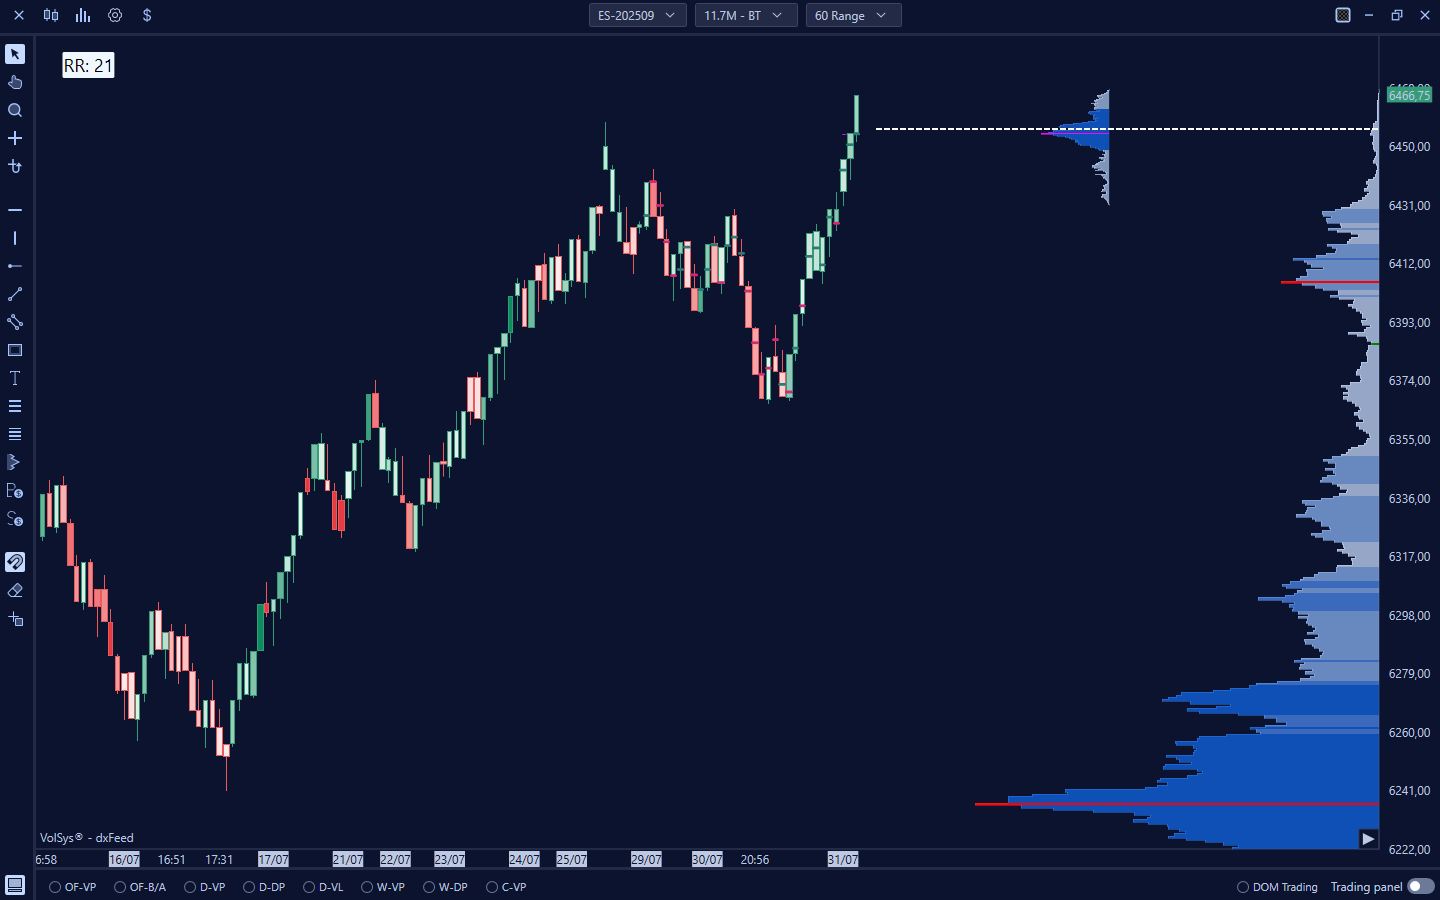
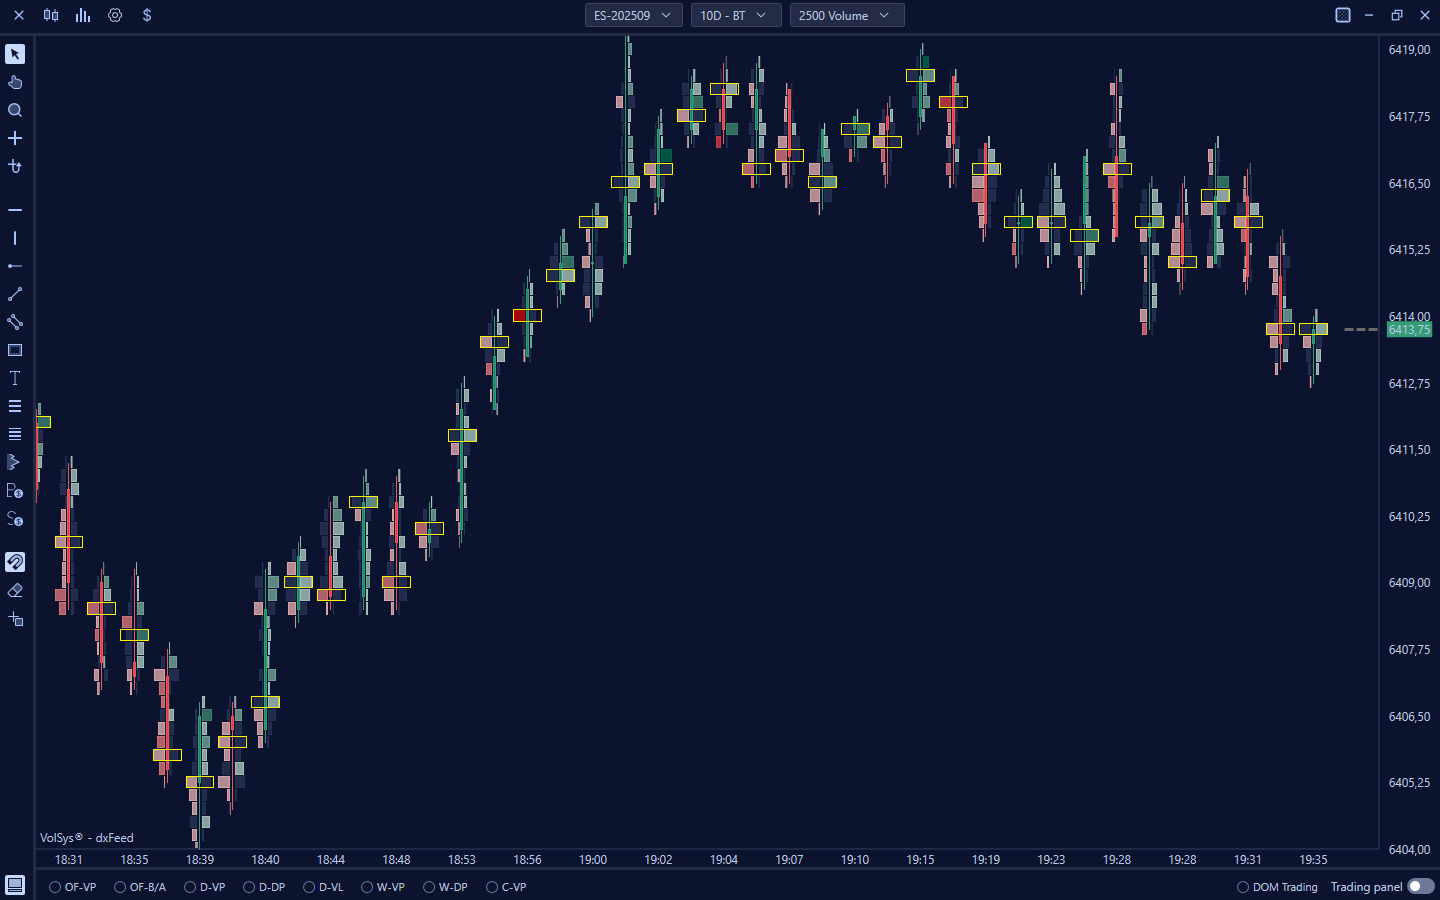
Big TradesWith the Big Trades feature, Volsys provides you with an essential tool for advanced market analysis. This indicator quickly detects and displays both aggregate and individual large orders, clearly signaling areas where high trading activity is concentrated. It is a key ally in accurately identifying critical levels of support and resistance, which often reflect the intervention of institutional traders or "strong hands" in the market.
In addition, Big Trades help identify areas of potential accumulation or distribution, providing a significant strategic advantage in interpreting order flow. Understanding where and when these high volumes are executed allows you to anticipate future price moves, providing crucial insights into the prevailing market direction. This ability to read the intentions behind large transactions greatly enhances your decision-making ability, allowing you to trade with greater awareness and precision. Start now
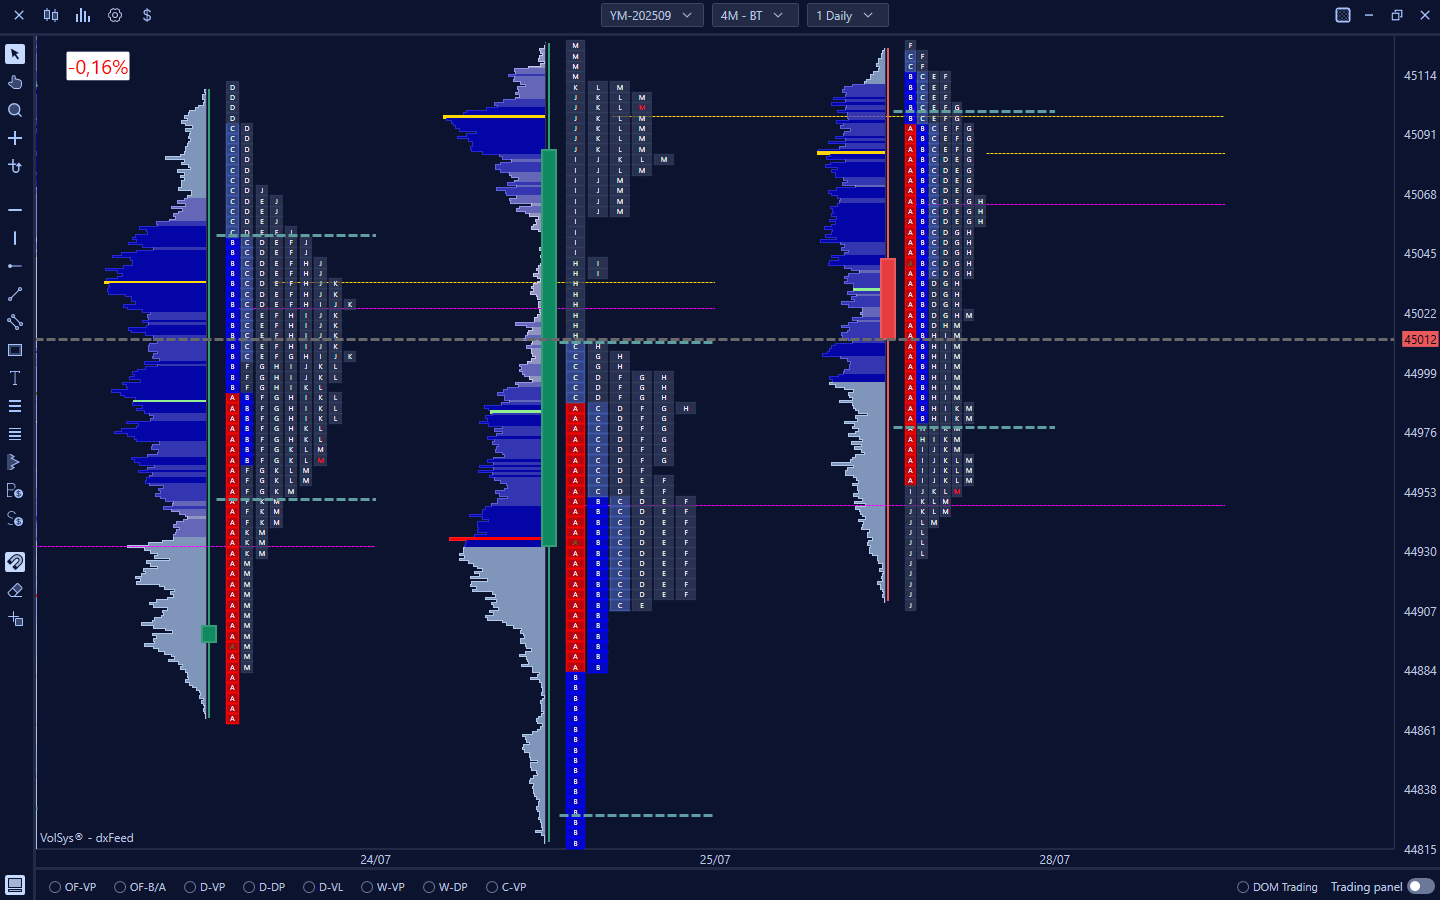
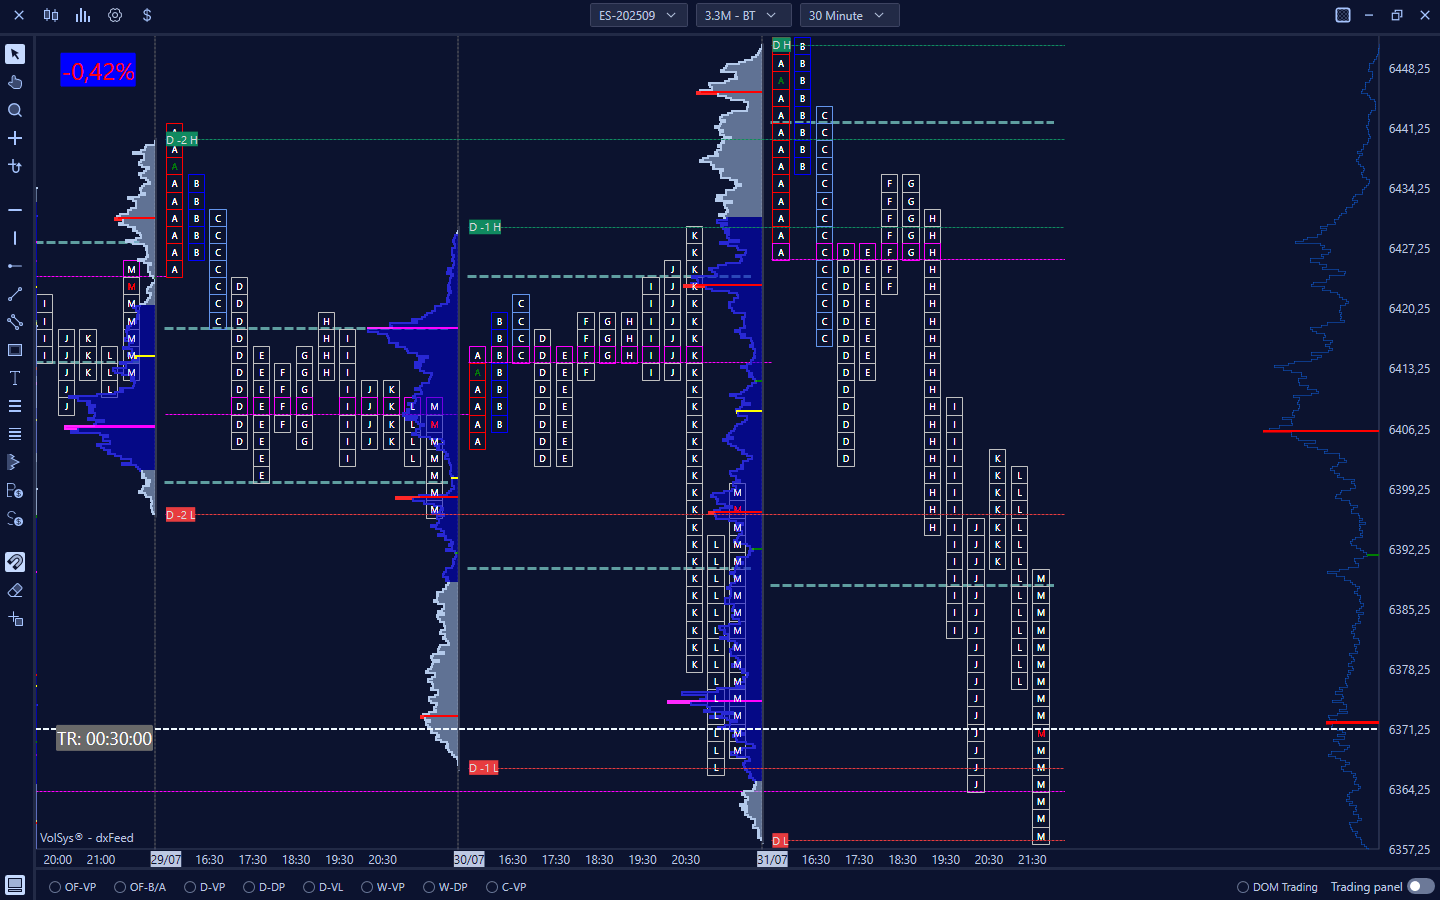
TPO Market ProfileTPO (Time Price Opportunity), also known as Market Profile®, is an advanced technical analysis indicator that offers a three-dimensional view of the market, uniquely displaying the intrinsic relationship between price, time and volume of an asset. Its uniqueness lies in organizing price vertically and time horizontally, generating a distinctive graphical profile that reveals the distribution of trading activity.
This powerful tool is critical for traders seeking to gain a thorough understanding of market structure, as it helps to accurately identify levels of greatest time concentration, i.e., areas where price has spent the most time. It also makes it possible to identify significant areas of consolidation and to define the "fair value" of the market, providing a clear representation of where most of the interaction between buyers and sellers has occurred. Understanding the Market Profile® means having a magnifying glass on institutional points of interest and the logic underlying price movements. Start now
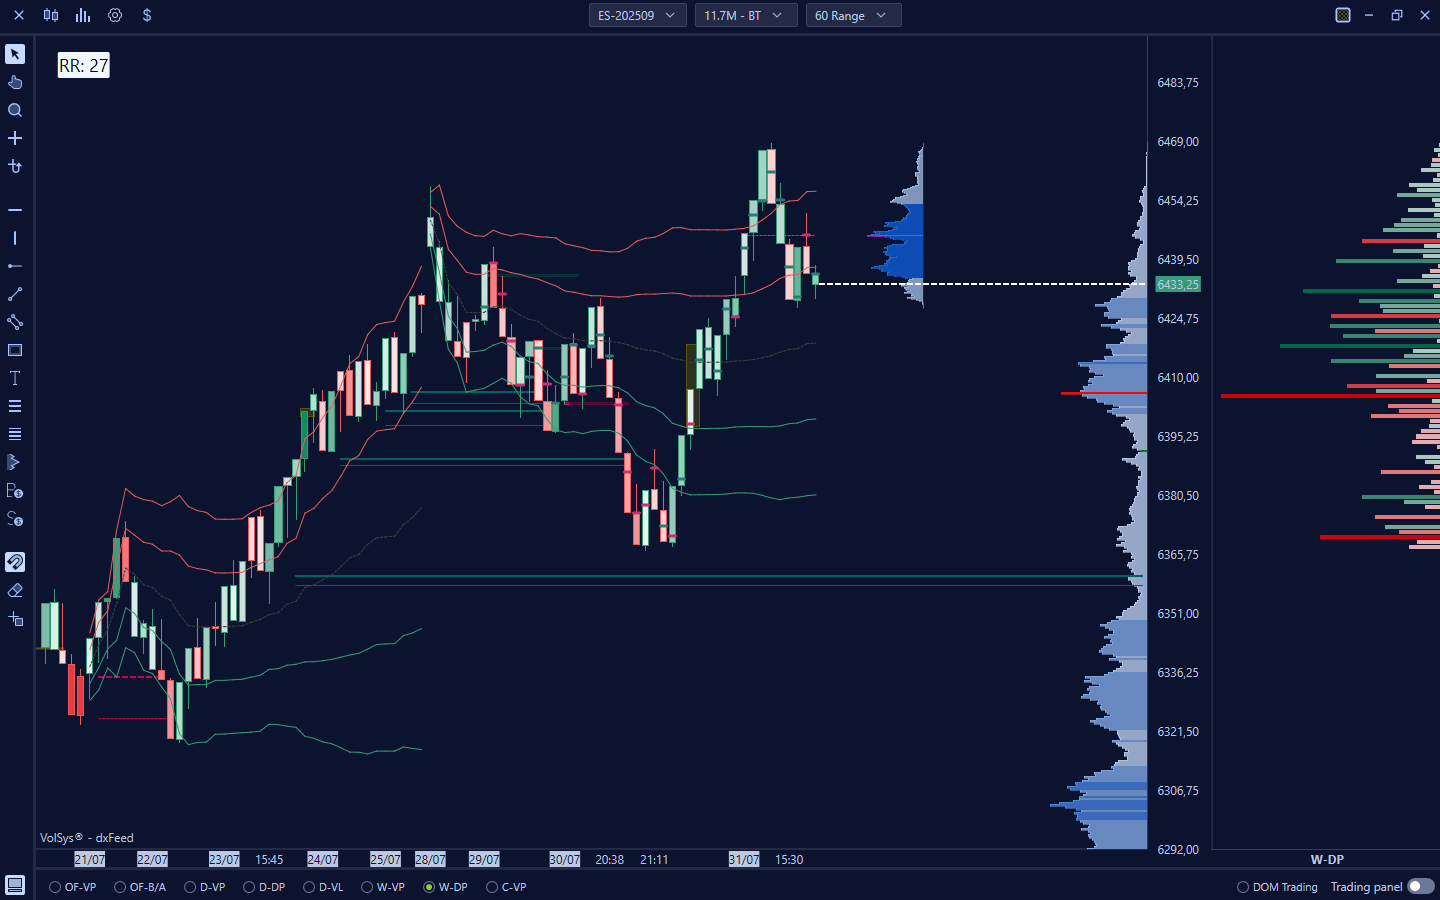
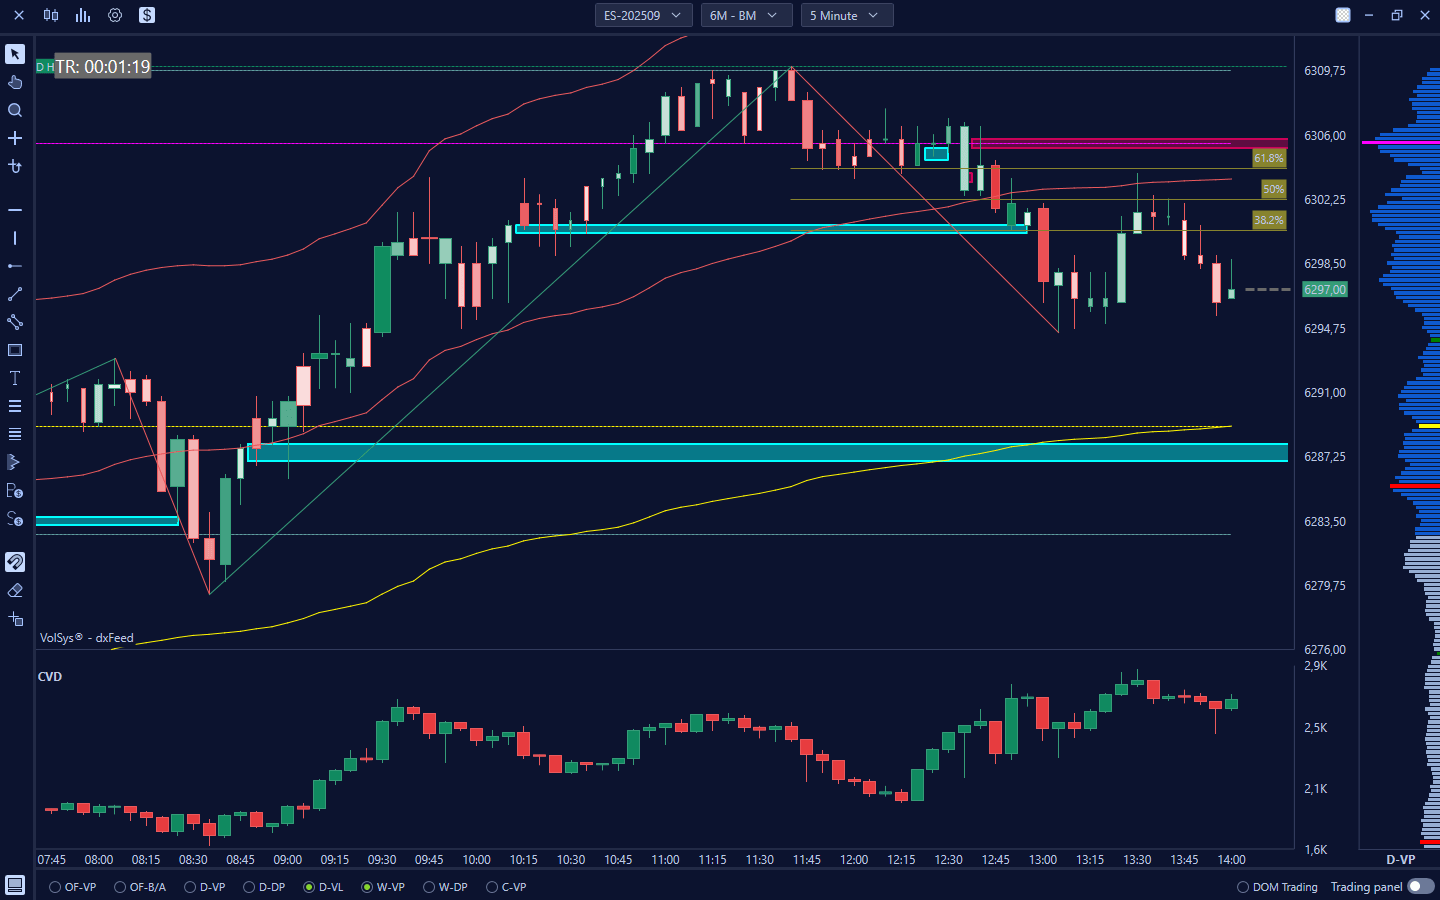
VWAP + EnvThe VWAP + Env (Envelopes) feature is an indispensable tool that Volsys puts at your disposal for in-depth market analysis. This indicator displays not only the Volume Weighted Average Price (VWAP), a dynamic line representing the average price at which an asset was traded, but also its Standard Deviations (Envelopes). These bands, which extend above and below the VWAP, are extremely useful for identifying the current volatility of the market and for accurately identifying "Premium" or "Discount" price zones.
"Premium" areas indicate prices above the VWAP, where the market could be considered "expensive" and potential for a pullback. Conversely, "Discount" areas suggest prices below the VWAP, where the market could be considered "cheap" and present buying opportunities. Understanding the relationship between price and these VWAP bands enables you to assess the strength and sustainability of a move, providing crucial insights for making more informed and timely trading decisions, maximizing profit potential and better managing risk. Start now
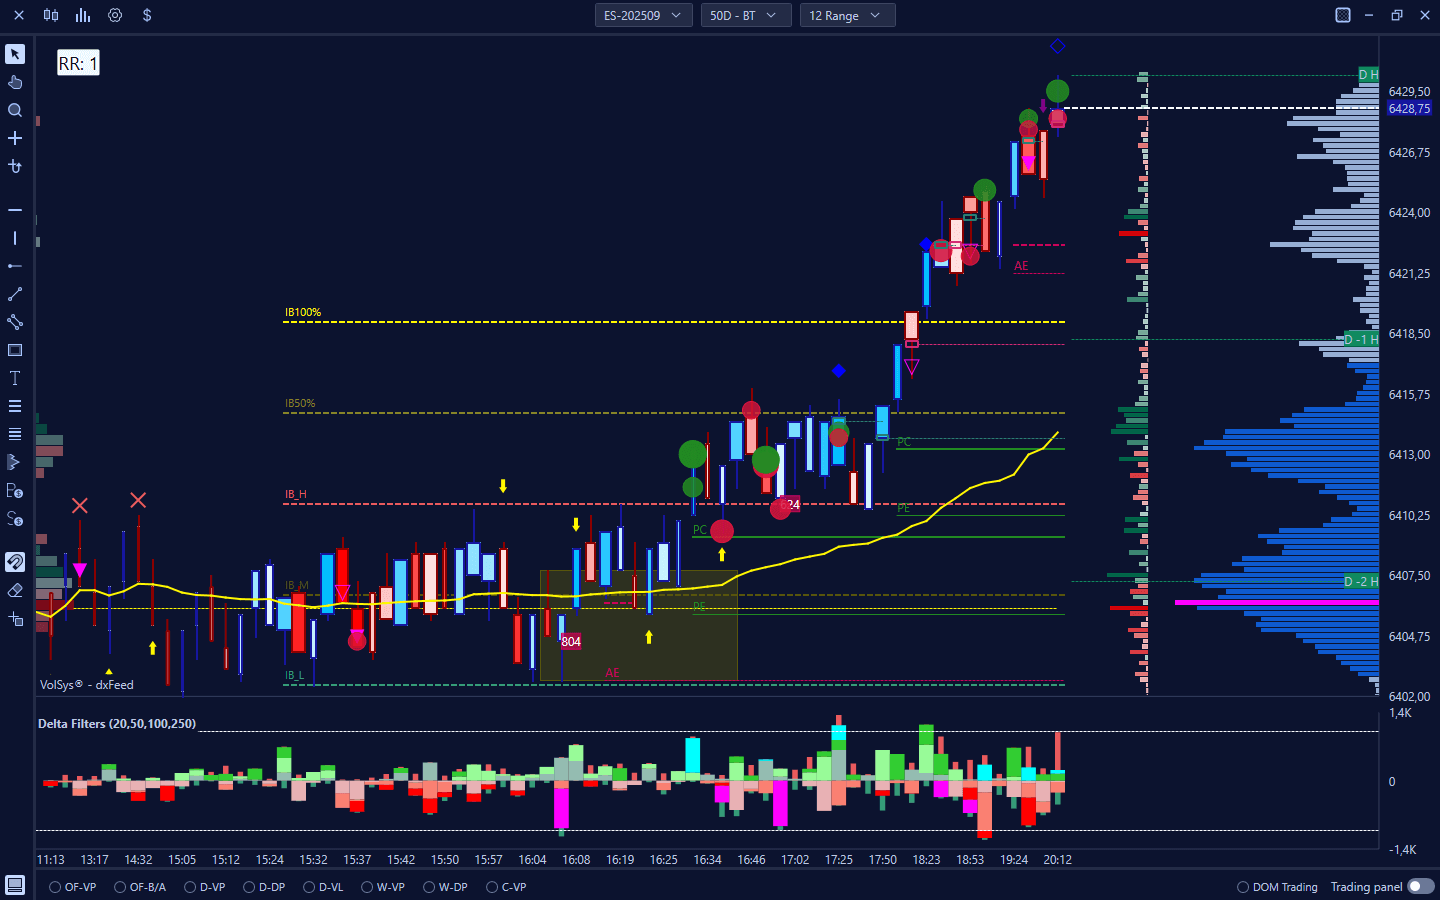
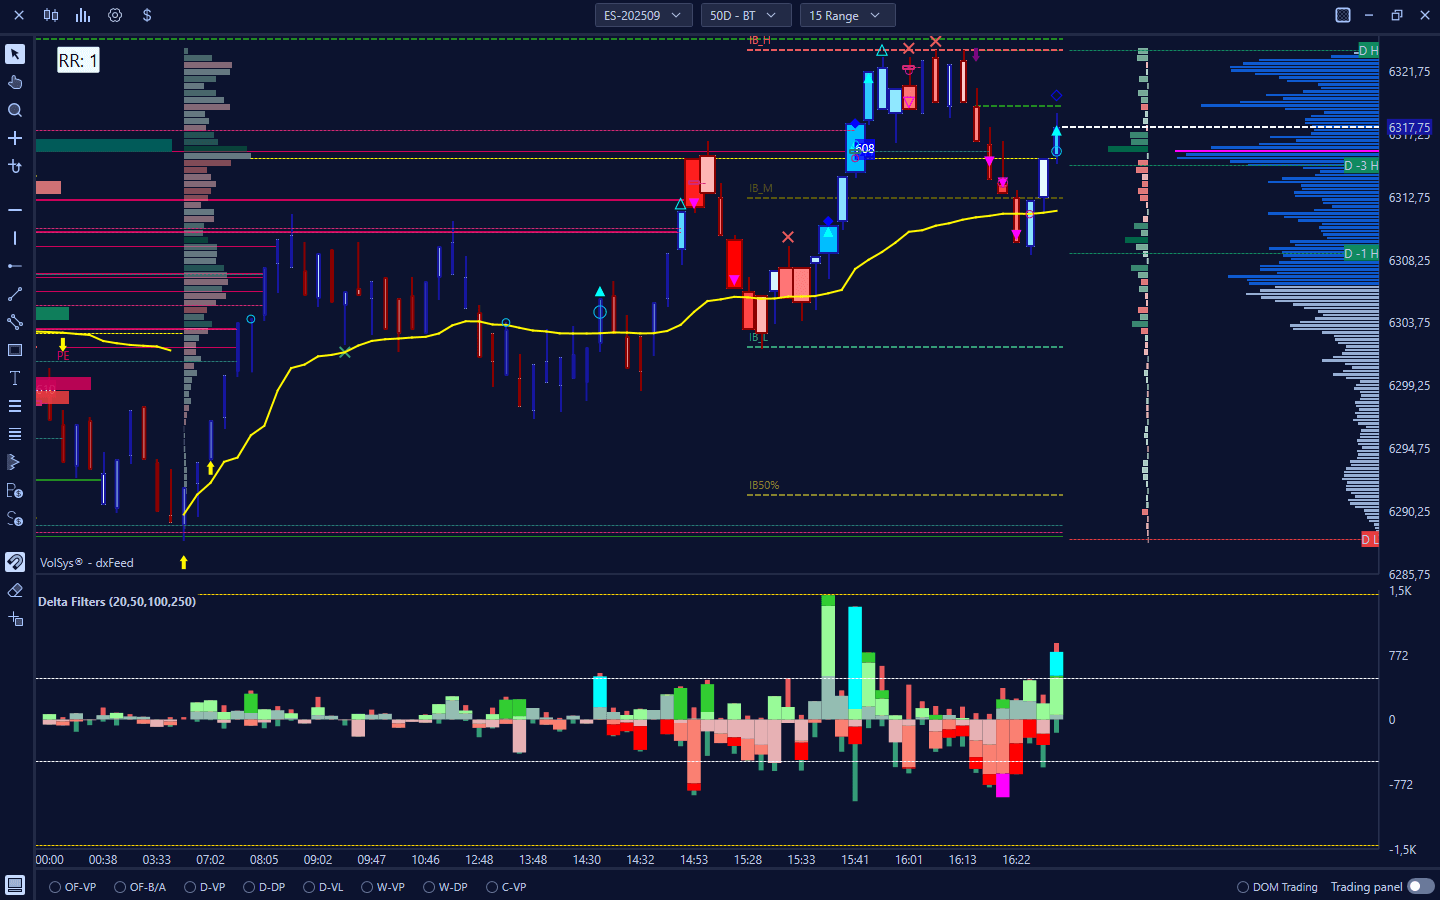
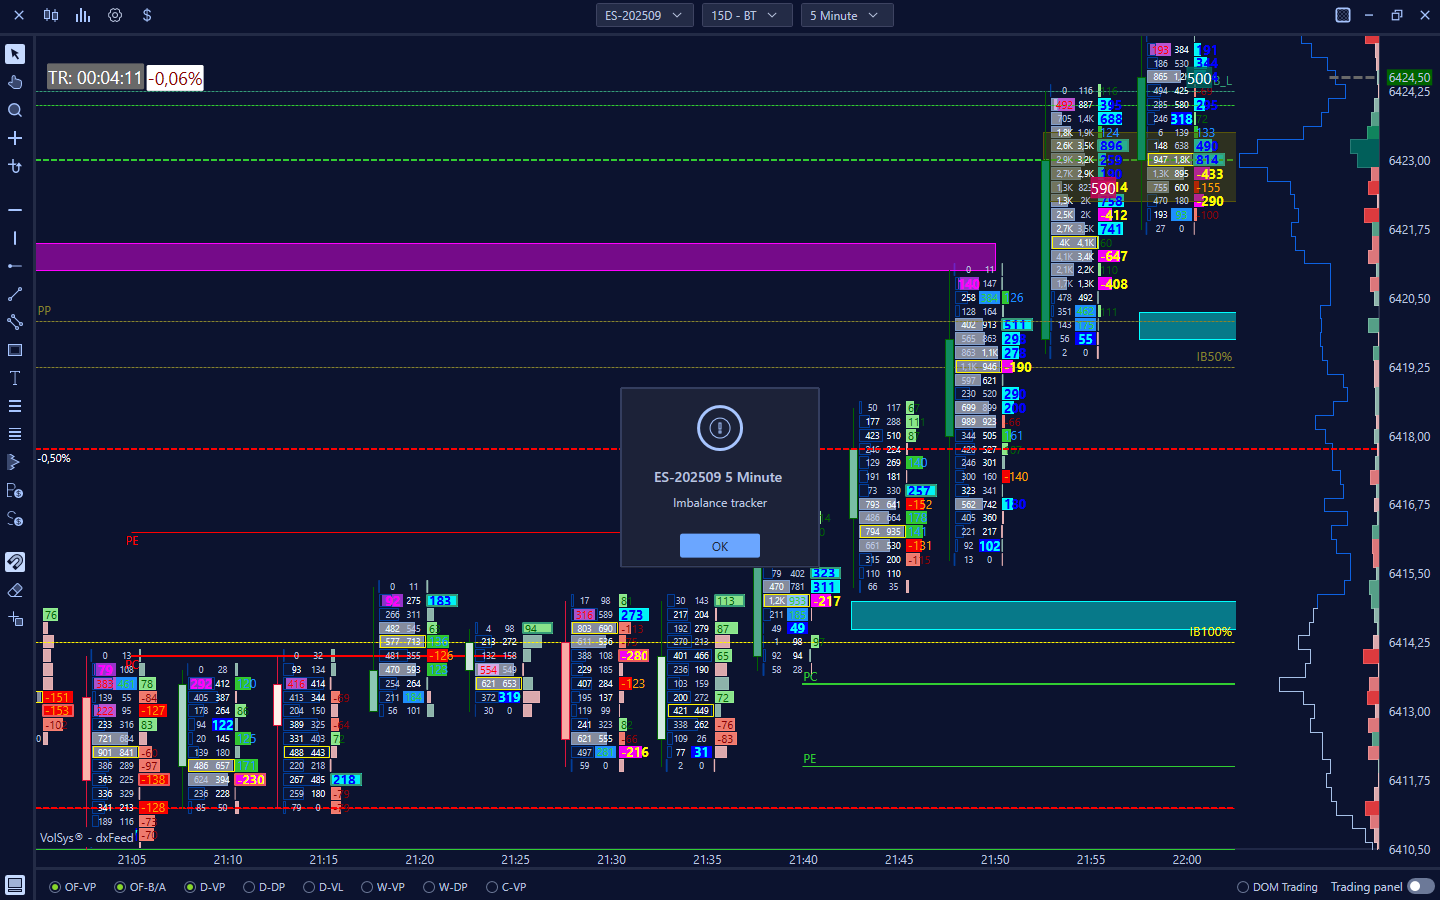
Other Volumetric IndicatorsVolSys offers you an advanced suite of volumetric indicators crucial for in-depth analysis and a competitive edge in the market. Tools such as the Pullback Bar, which analyzes retracements in real time, the Cumulative Volume Delta (CVD) for directional strength, the Delta Filter Bars, which filter out directional aggressiveness, and the Imbalance Tracker, which detects imbalances between buy and sell orders, allow you to identify supply/demand imbalances and high probability operating areas. The Confluence Identifier identifies support/resistance zones between Price Action and Volumes. In addition, the Price Rejector alerts you to price levels where the market has been strongly rejected, indicating potential reversals or continuations. Finally, Market Statistics helps you calibrate your indicators. This comprehensive suite gives you unprecedented insight into market dynamics, greatly enhancing your decision-making ability. Start now
Charting Analytics
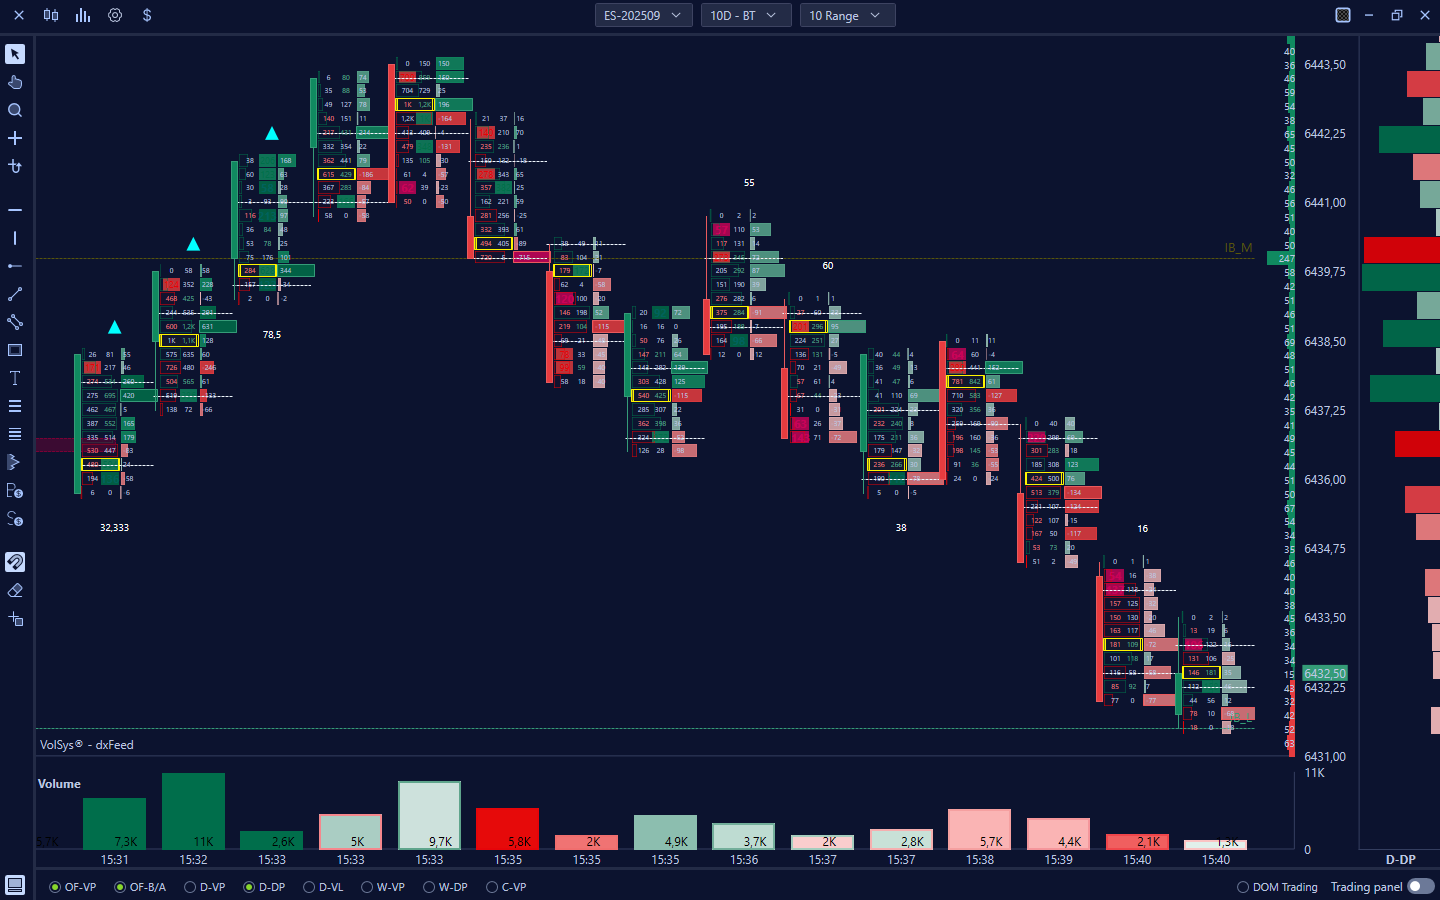
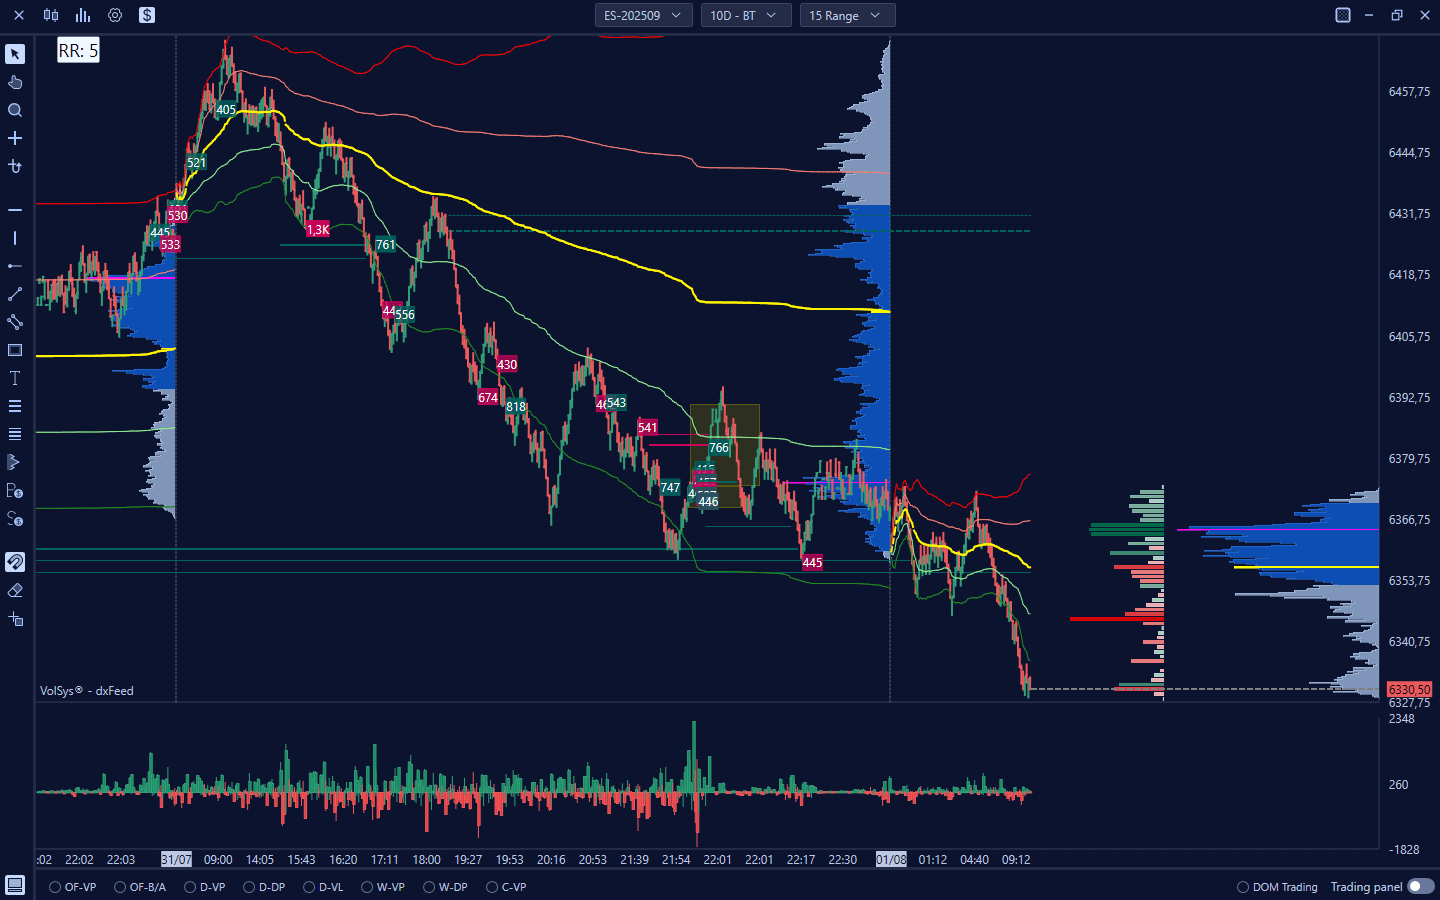
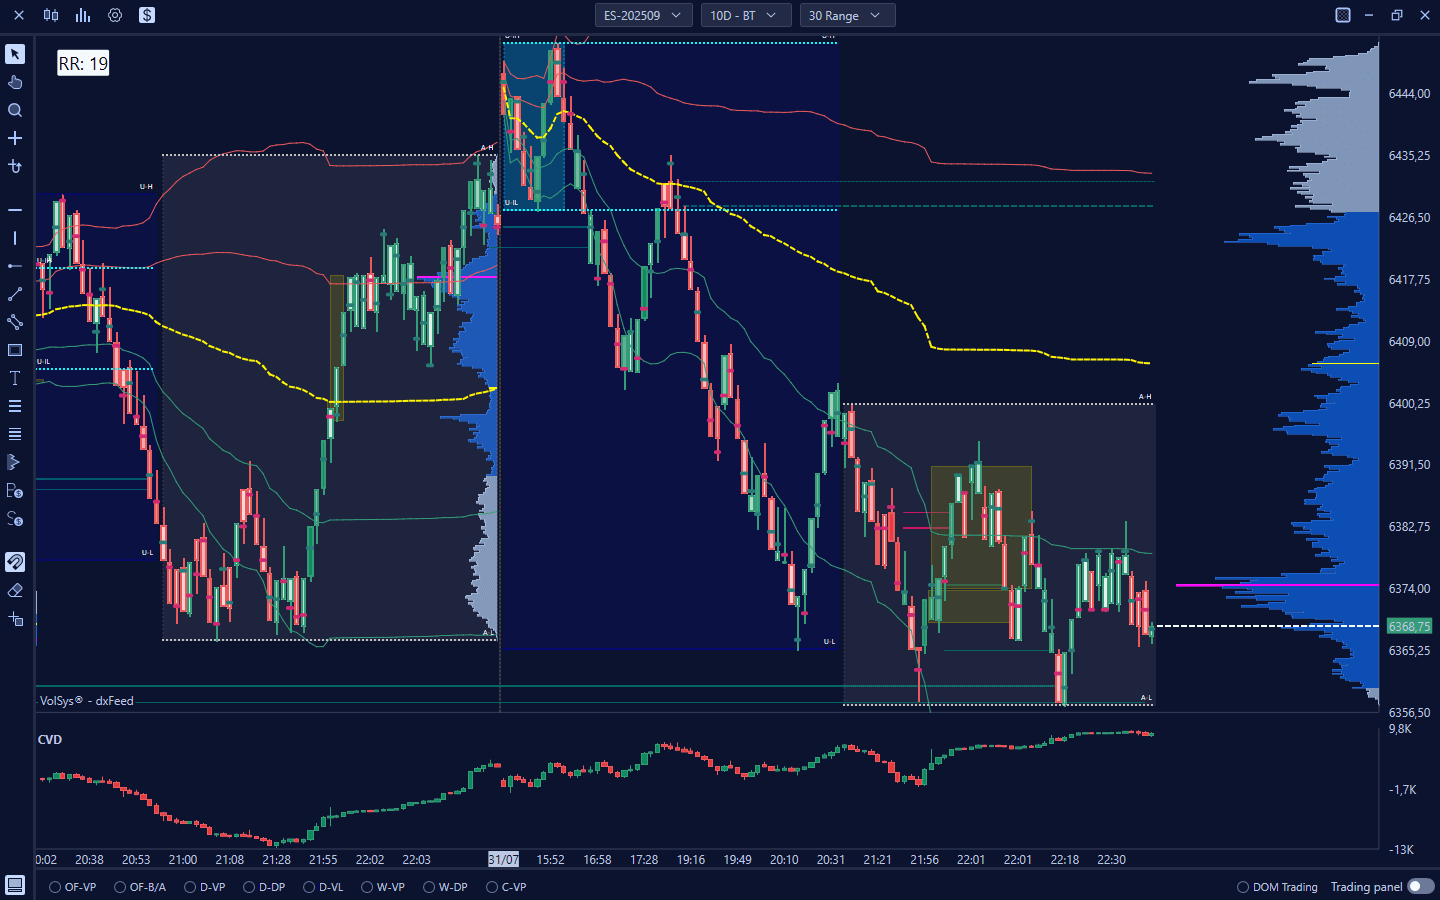
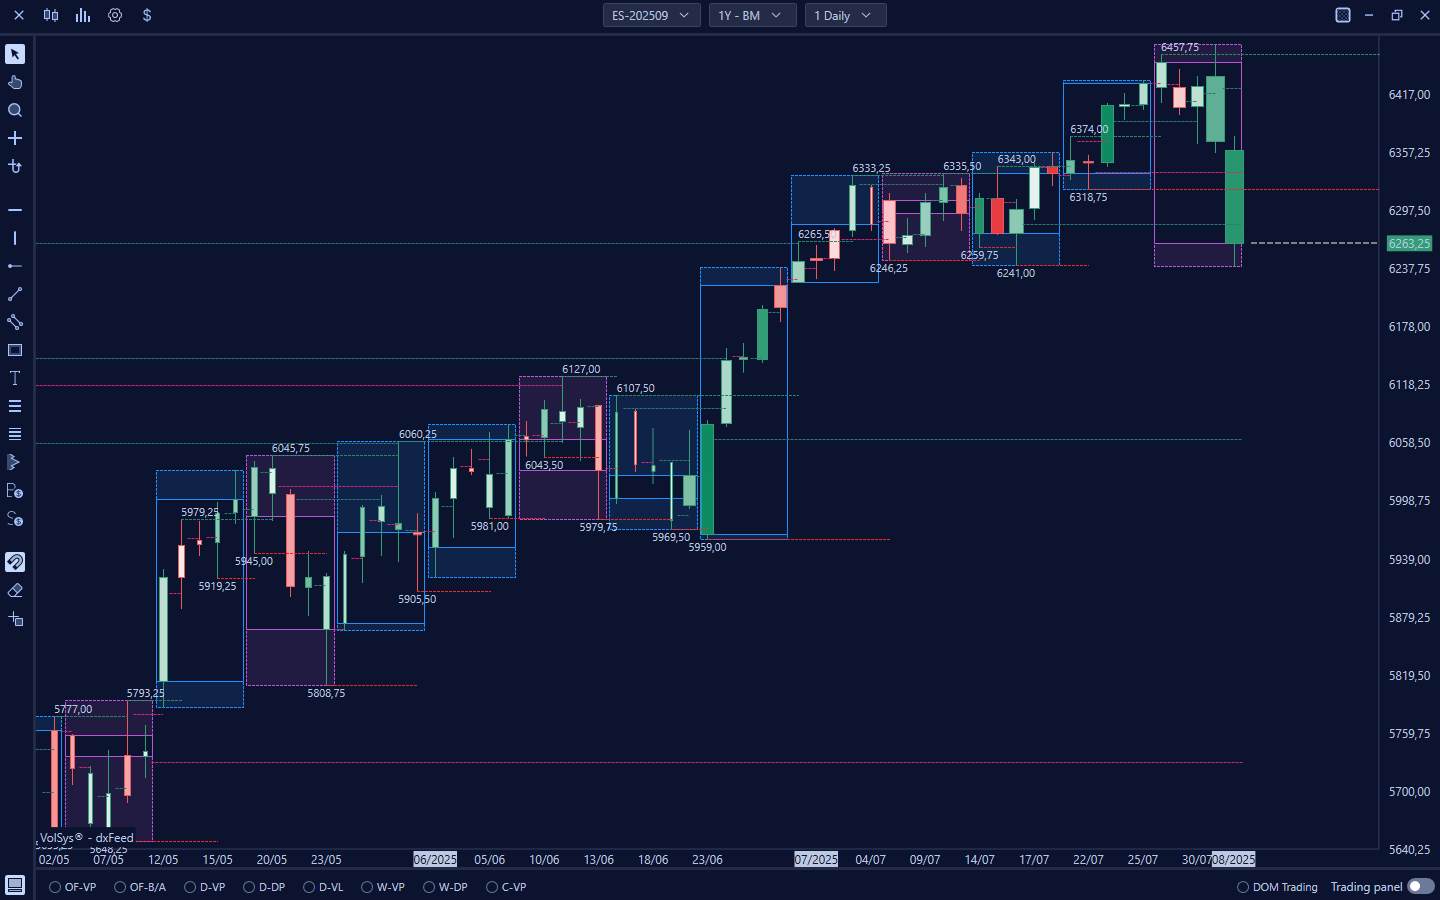
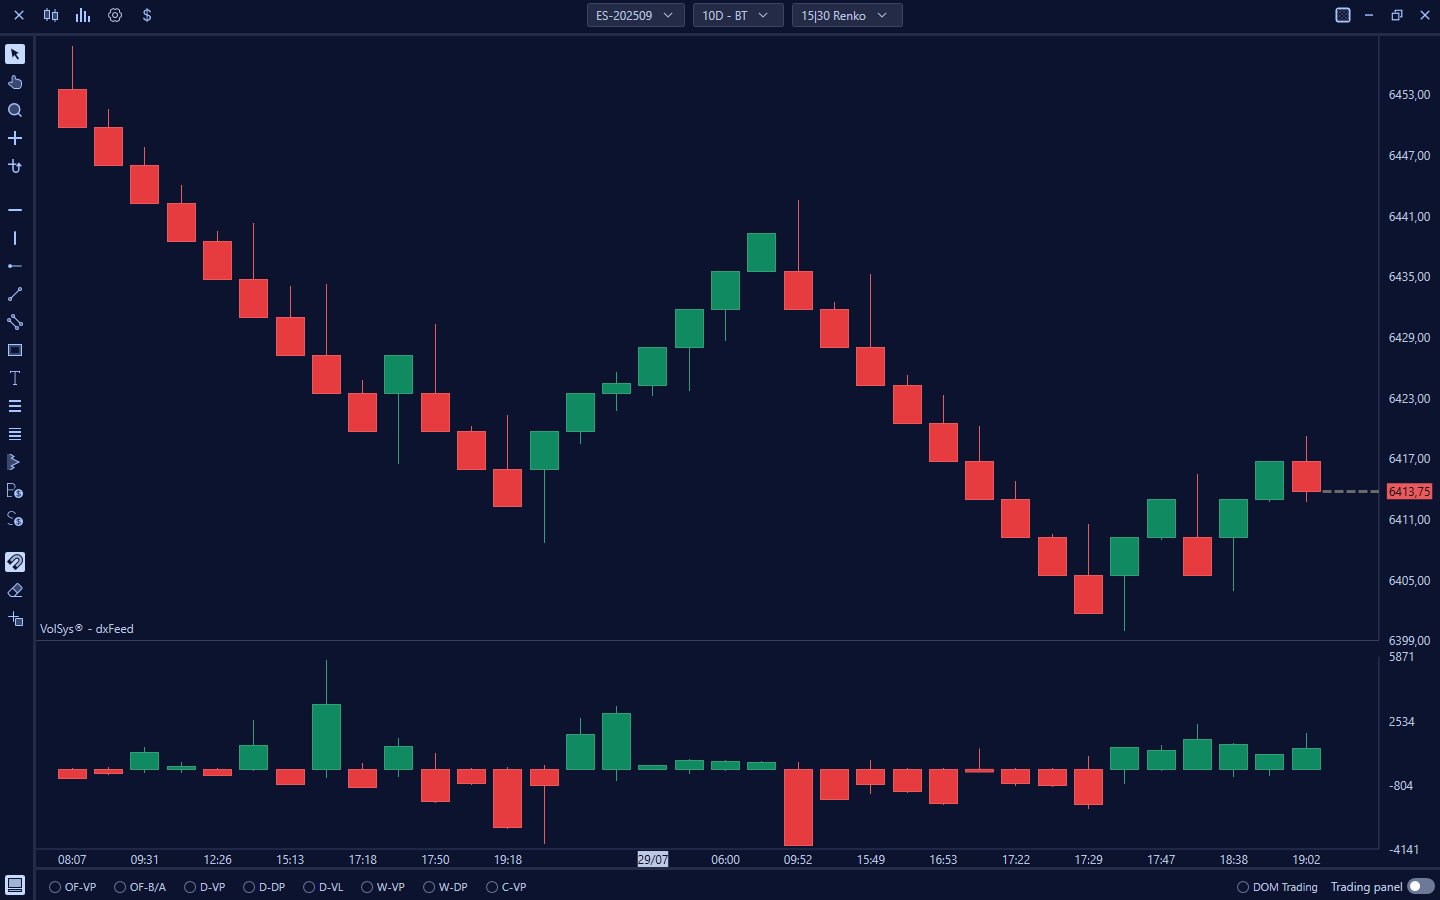
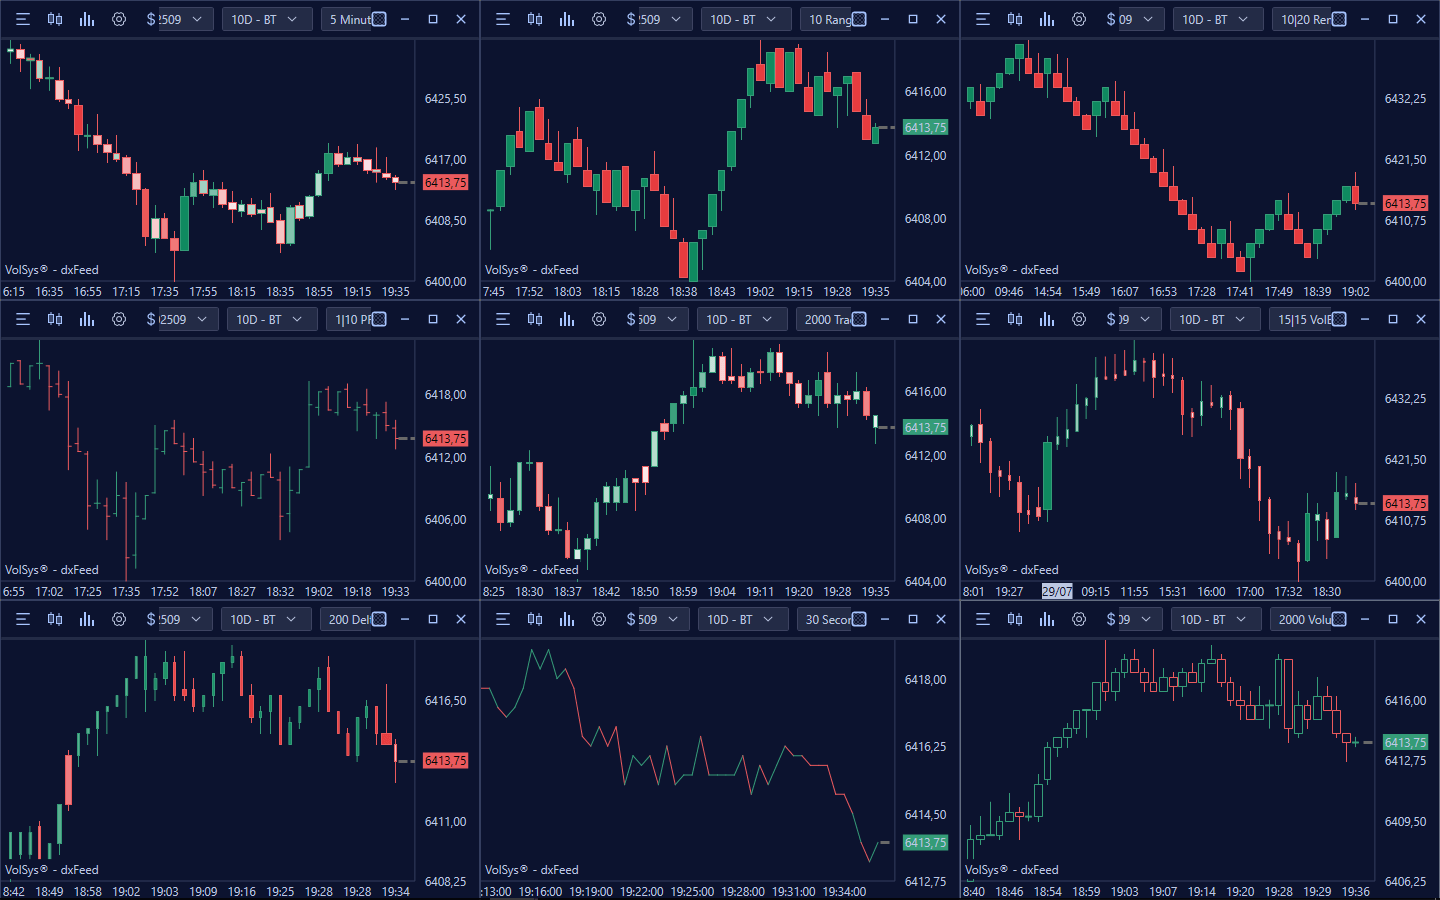
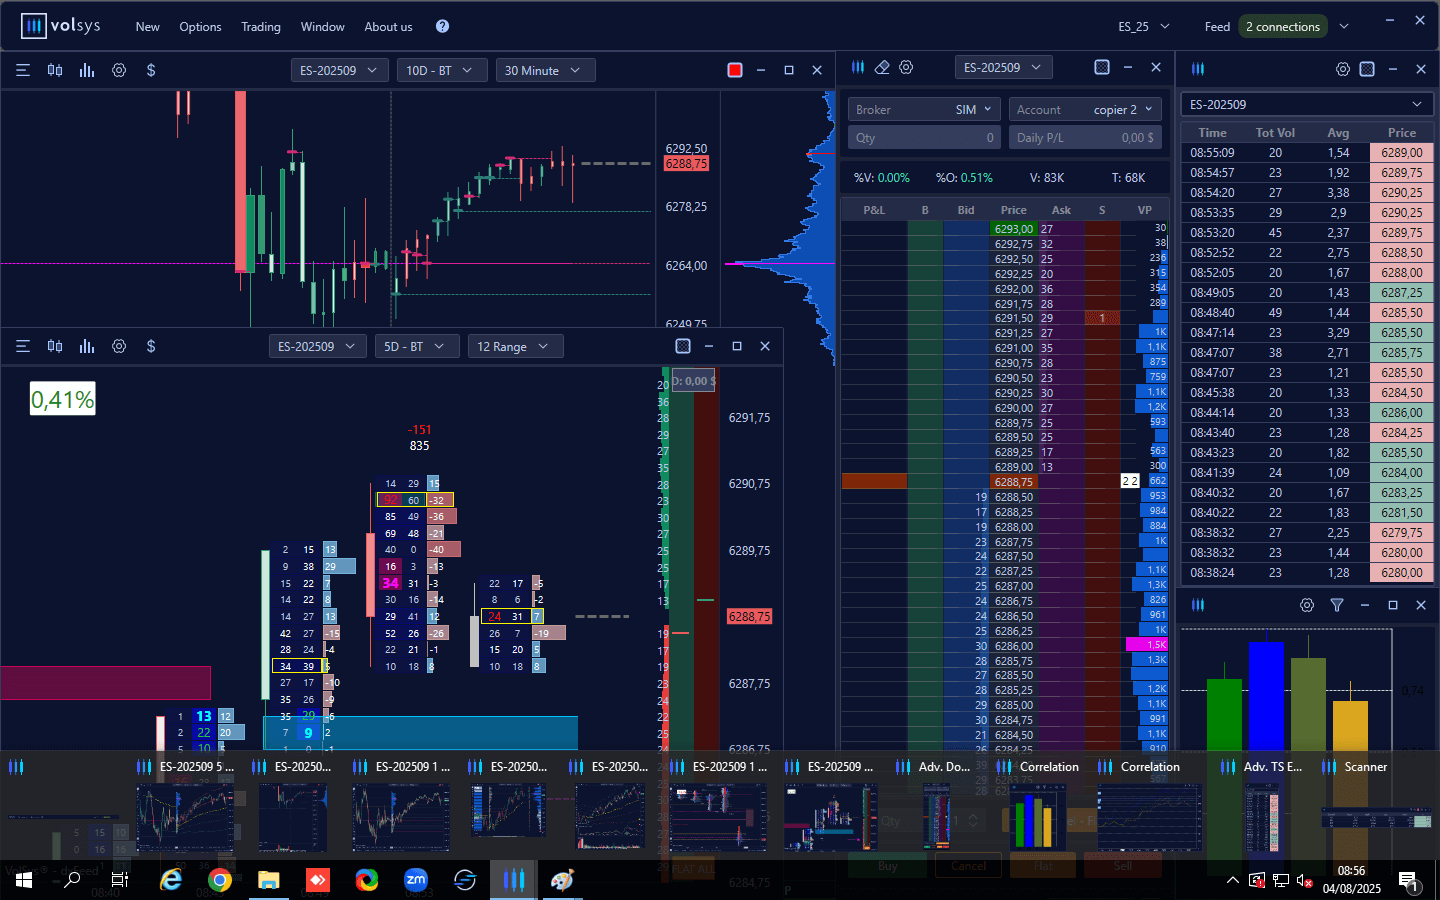
Type of bars on chartVolSys offers a wide range of chart types for every trading need, going beyond the classic time-based charts (Seconds, Minutes, Days, Weeks, Months). Advanced options include: -Vol Bars (Target/Reverse): Create a new bar after a minimum excursion (Target) and subsequent retracement (Reverse), based on ticks. -Range: Each bar has a predefined amplitude in ticks; a new bar is formed when price moves beyond the specified amplitude. -Volume: A new bar is generated once a predefined maximum volume is reached. -Trade: Bars are formed when a maximum number of trades is reached. -Renko: Similar to Ranges, they create a new bar when price moves by a number of ticks defined by the "body" of the previous candle. -Point Figure (Box Size/Reversal Amount): They create a new candle when price undergoes a retracement equal to the "Reversal Amount" parameter from the high/low of the previous candle. -Delta: A new bar is formed when the delta (difference between buying and selling volumes) in absolute value reaches a predefined value.Start now
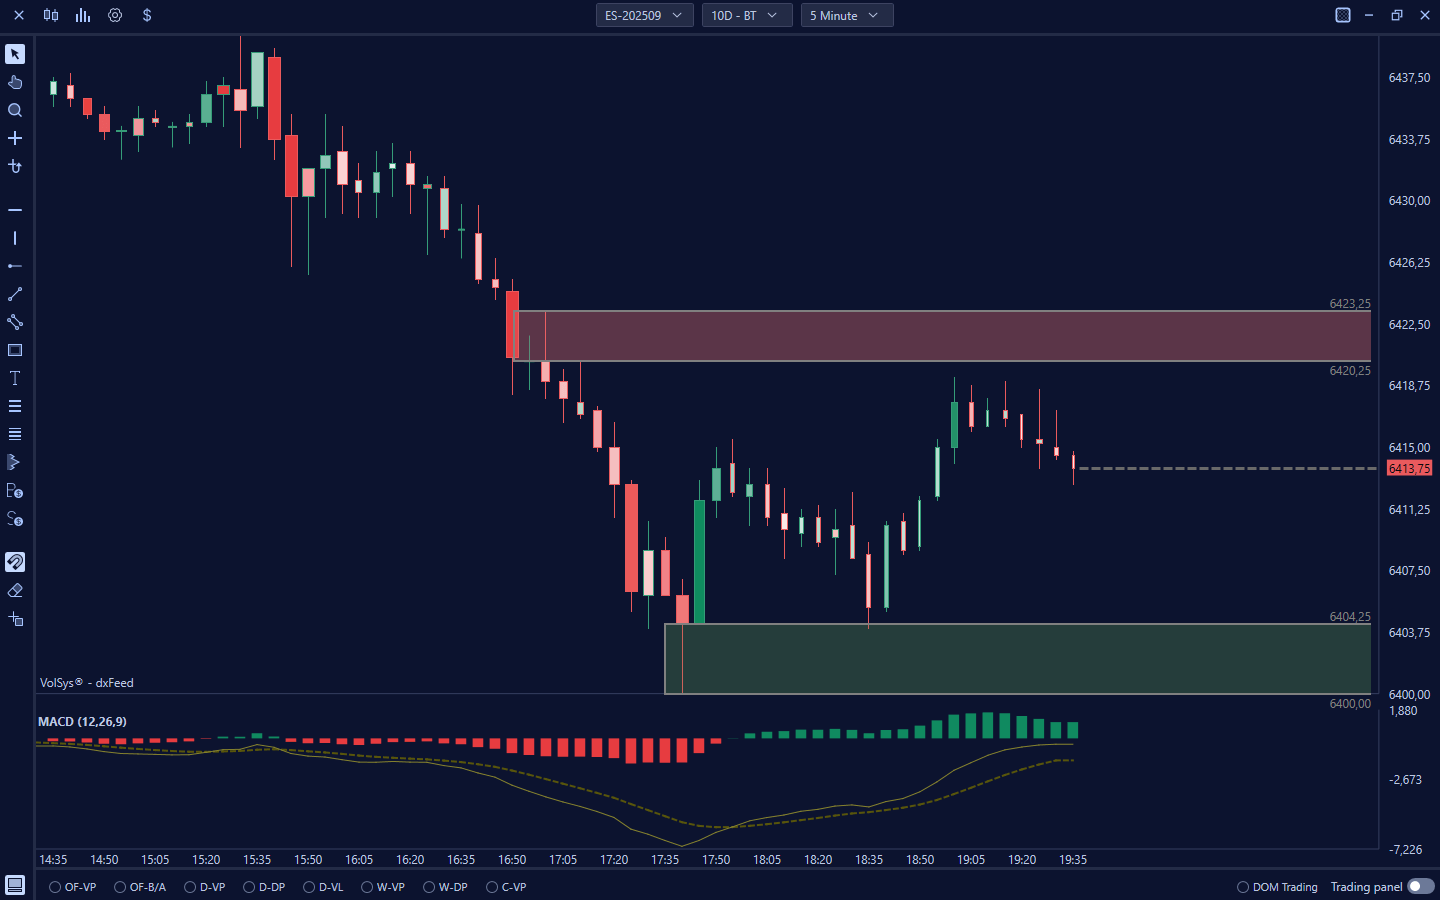
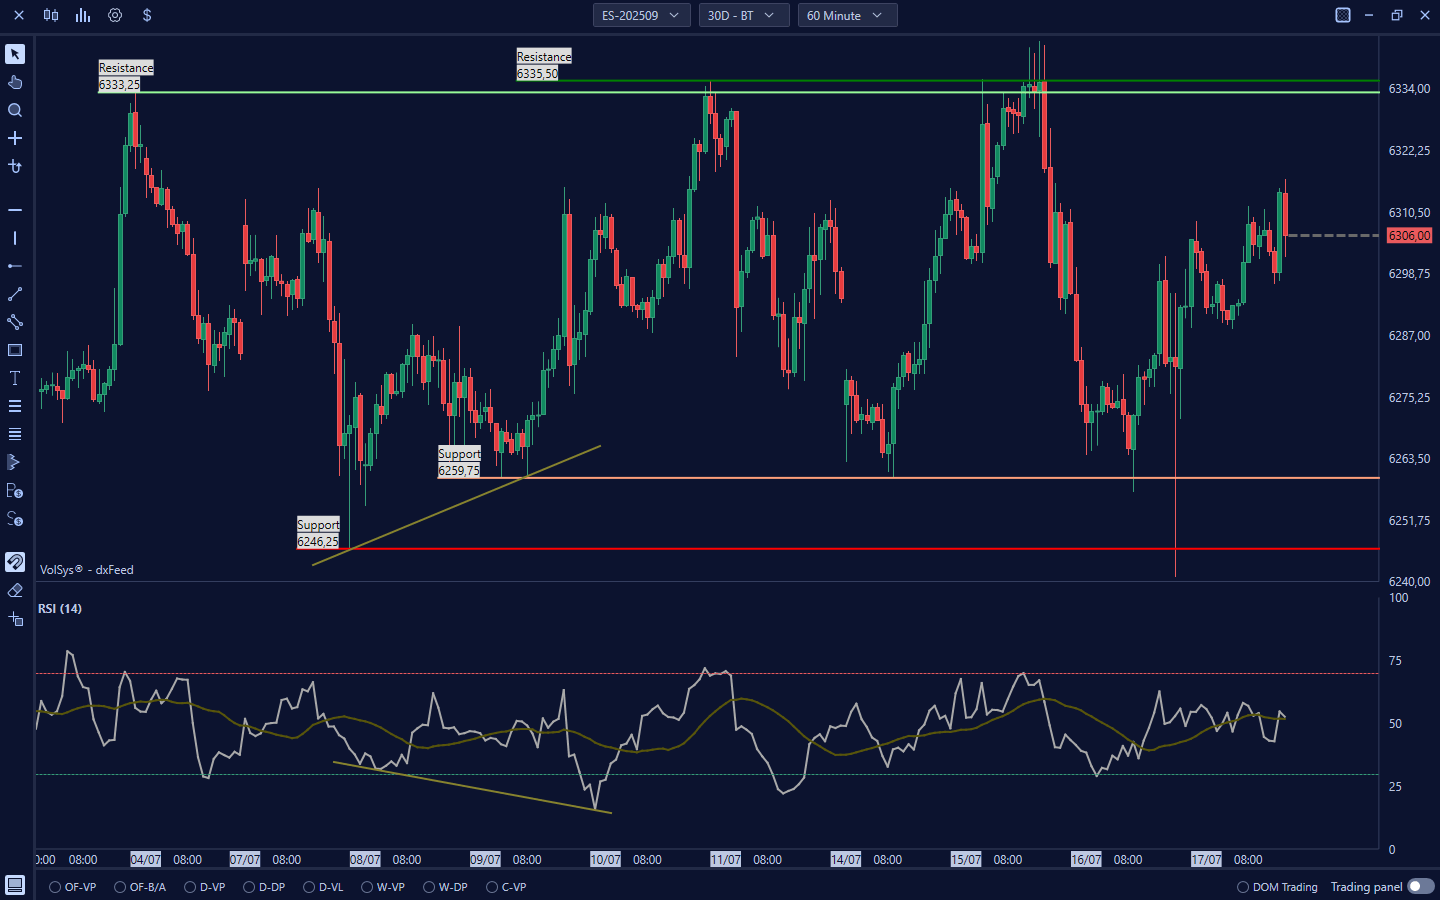
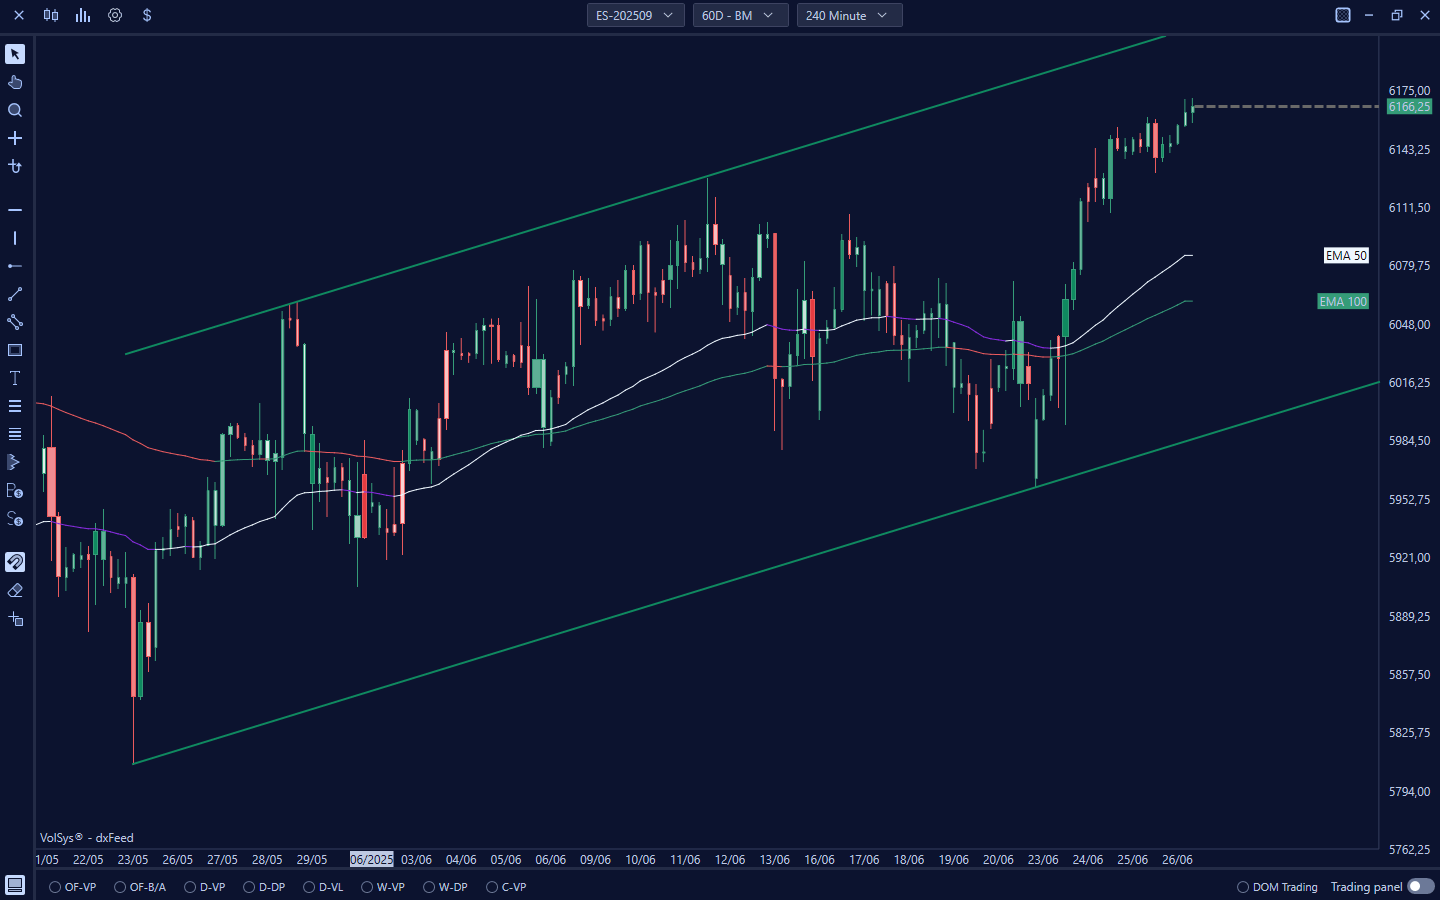
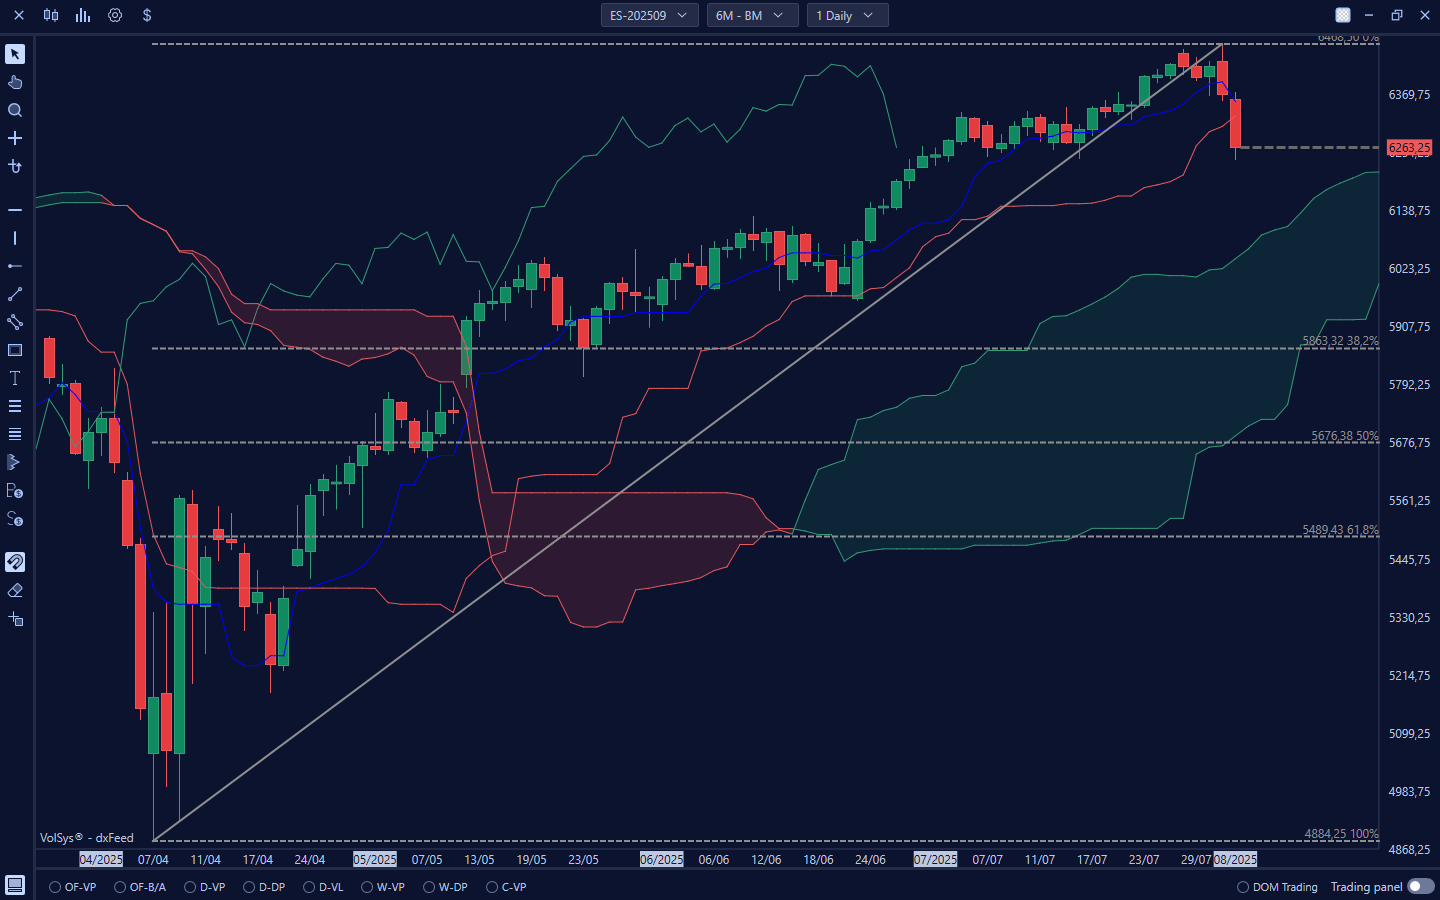
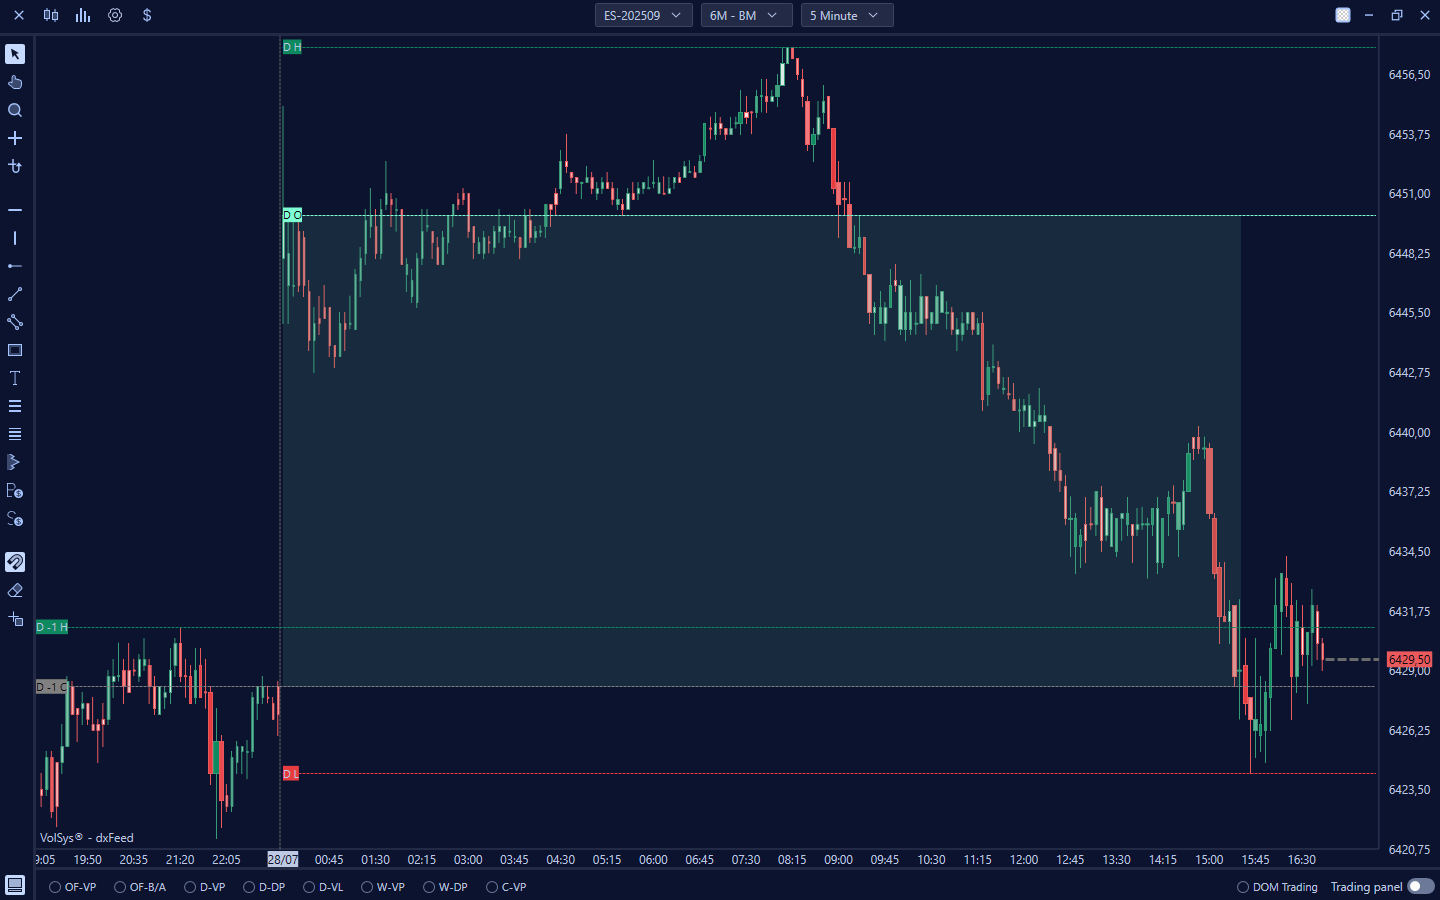
Indicators and drawing toolsA rich selection of technical analysis indicators and drawing tools to support every trading style. Trendlines, Channels, Fibonacci Levels, Supertrends, Moving Averages, RSI, MACD, Bollinger Bands, and many other customizable indicators for accurate and in-depth technical analysis. For session analysis, there are Session Imbalance, Session Zone and Important Levels (daily, weekly, monthly), as well as Range Target. The platform allows instruments and indicators from one chart to be displayed on other charts in the workspace, includes multi-timeframe correlation indicators, offers templates for indicators, and an economic calendar with news alerts.Start now
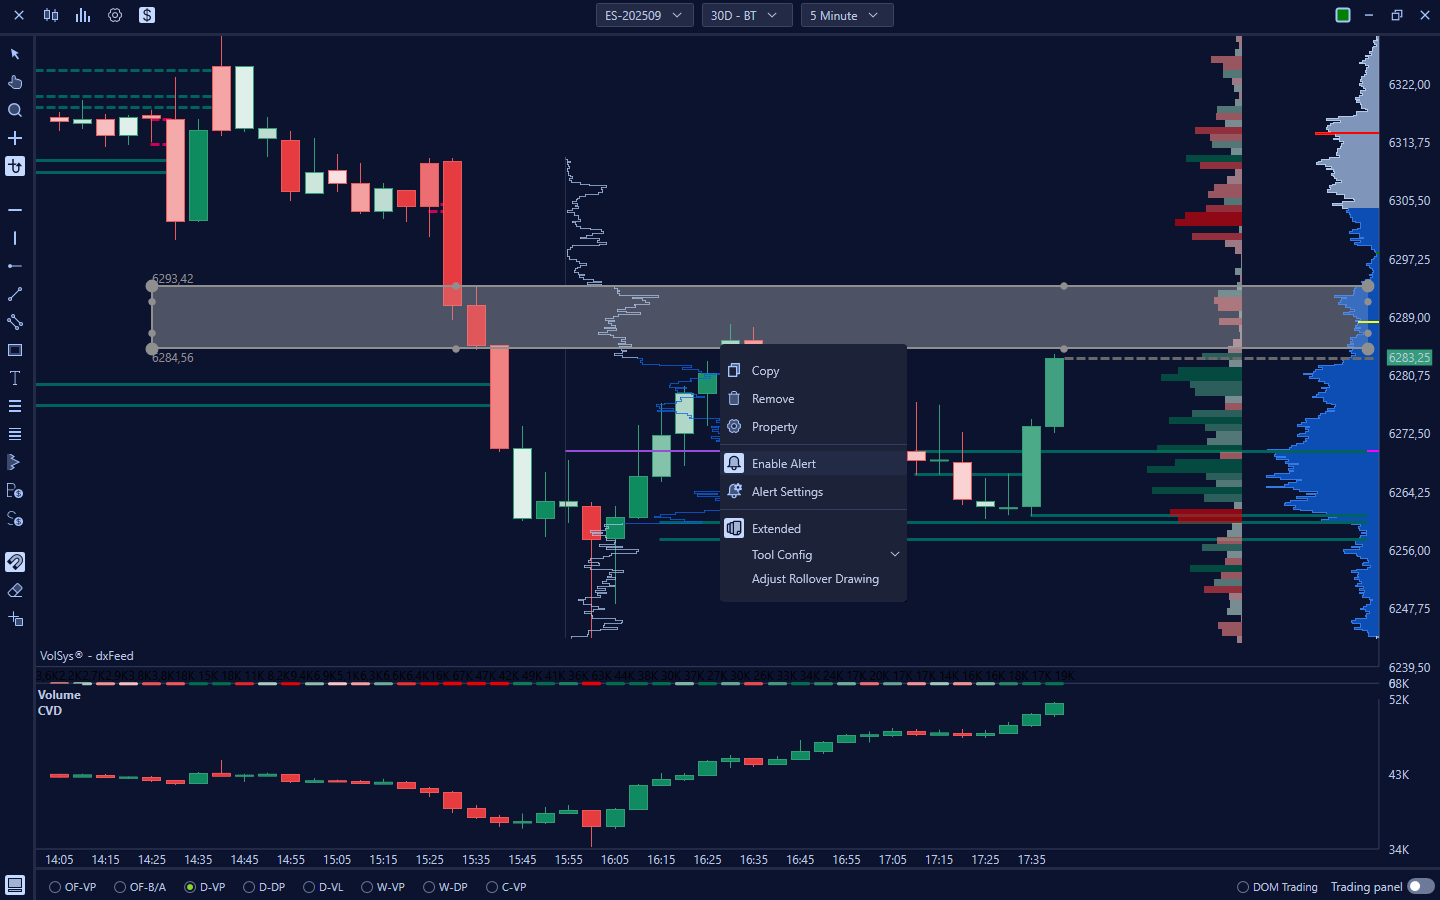
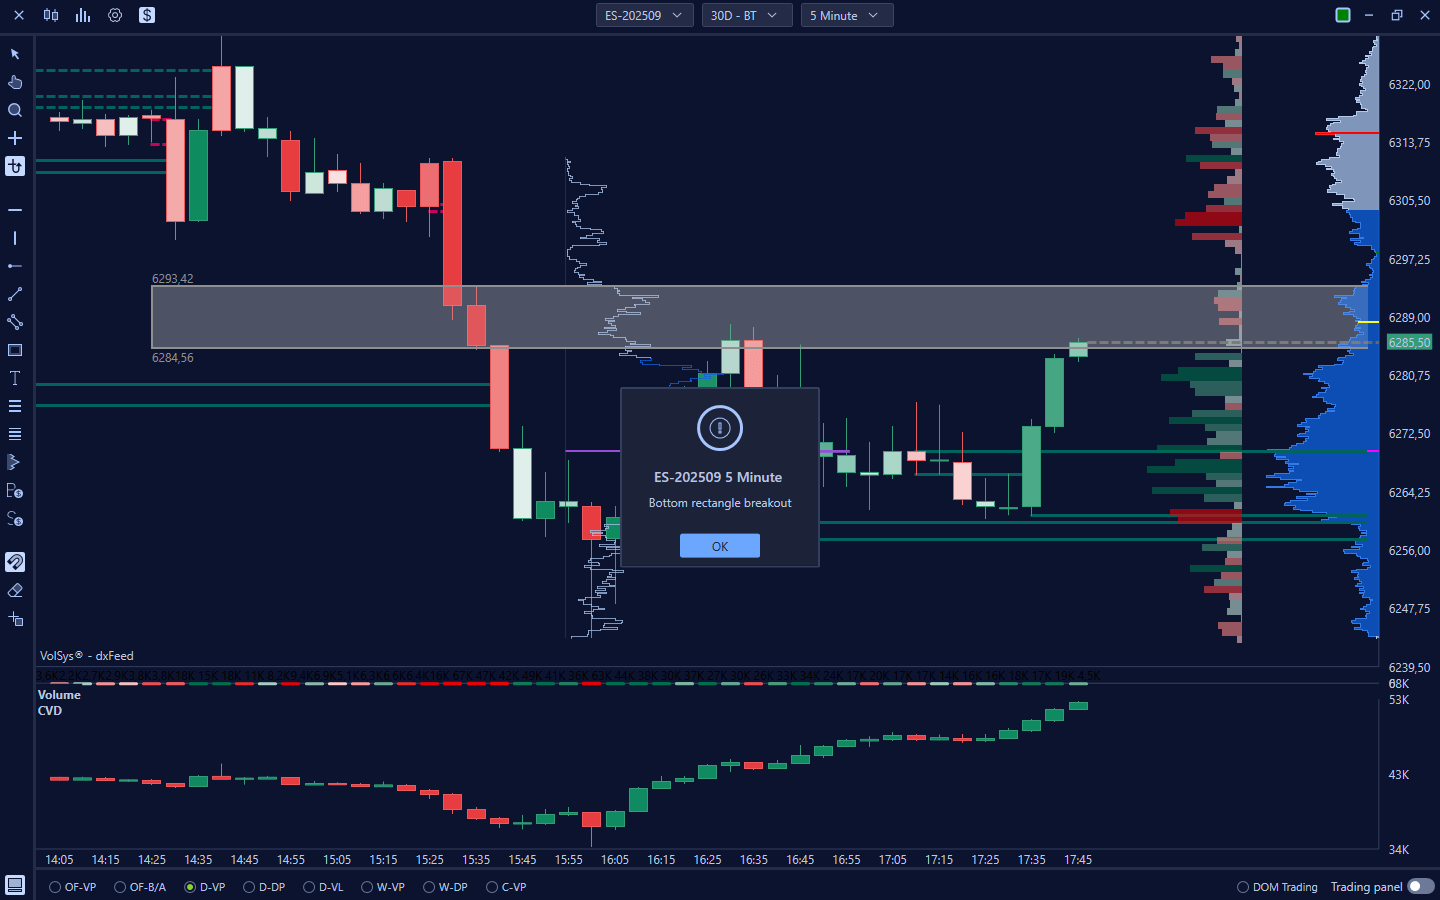
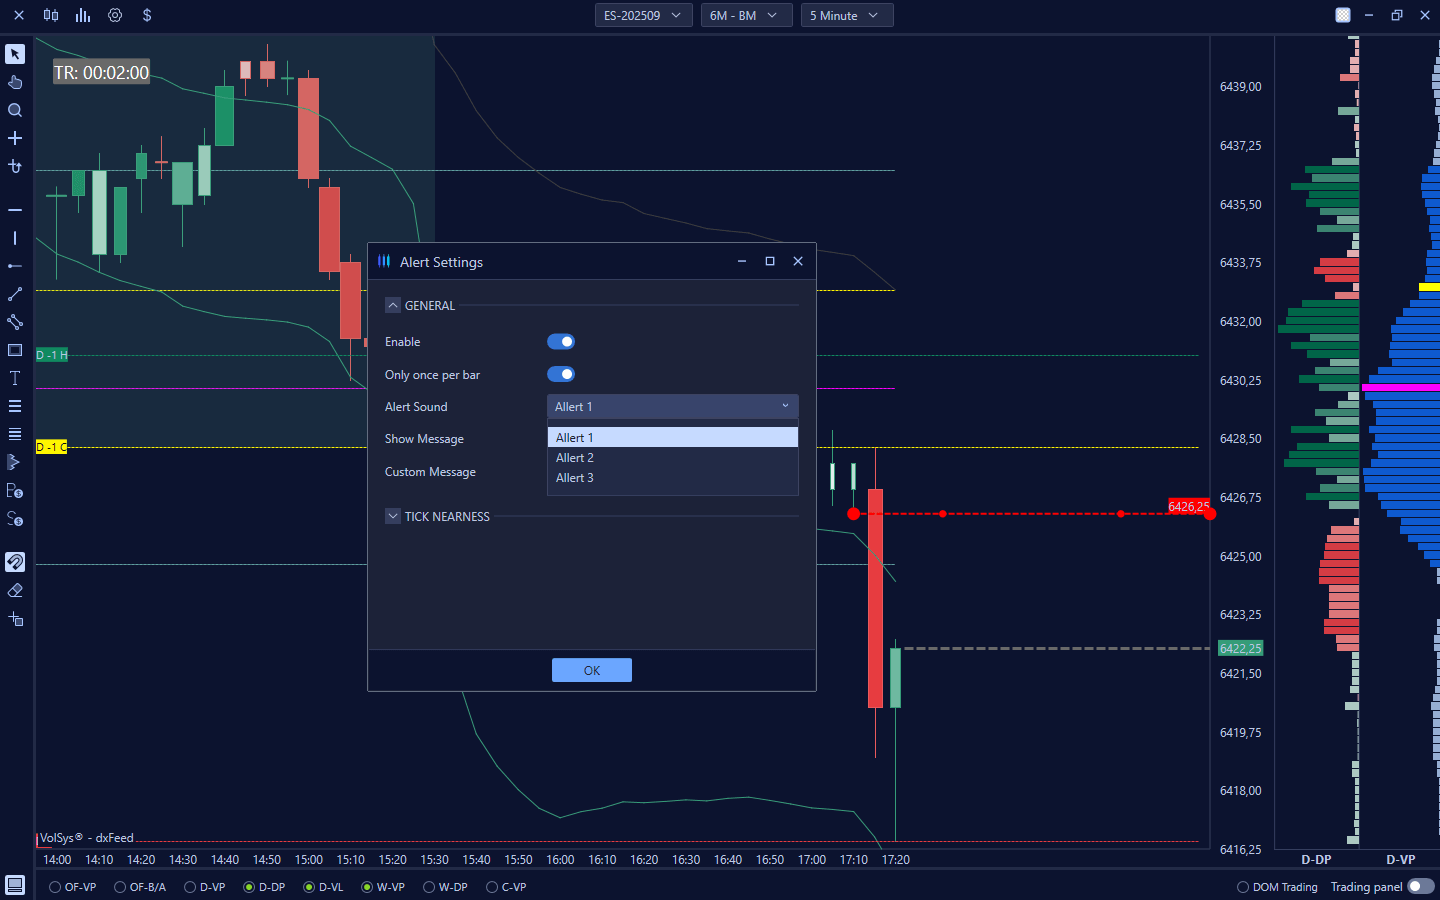
AlertWith VolSys, you'll never miss an opportunity thanks to customizable sound alerts. You can set alerts on all the drawing tools you plot directly on the chart, such as trend lines, support/resistance levels, or areas of interest. In addition, you have the flexibility to set up alerts on various technical indicators crucial to your strategy. This means you will be alerted in real time whenever important signals occur, freeing you from the need to constantly stare at the screen. The power of this combination of visual and audio tools is revolutionary: it dramatically improves your ability to follow the market dynamically and react promptly to any significant change. Being constantly updated, without the burden of uninterrupted monitoring, allows you to optimize your time and operate with greater peace of mind and precision, seizing the most promising opportunities on the fly. VolSys gives you the peace of mind of knowing that key signals will reach you, wherever you are. Start now
Workspace and graphic windowVolsys allows you to save your custom graphics and layouts within a dedicated workspace, ensuring quick recall each time you open the platform again. This quick and easy management ensures that your favorite layouts are always at your fingertips, improving operational efficiency. In addition, Workspace on Cloud elevates this convenience. By saving your charts and layouts to the cloud, you can recall them instantly from any device. This means maximum operational continuity and flexibility, allowing you to access and work with your preferred settings wherever you are, keeping your analysis and setup in sync at all times. Start now
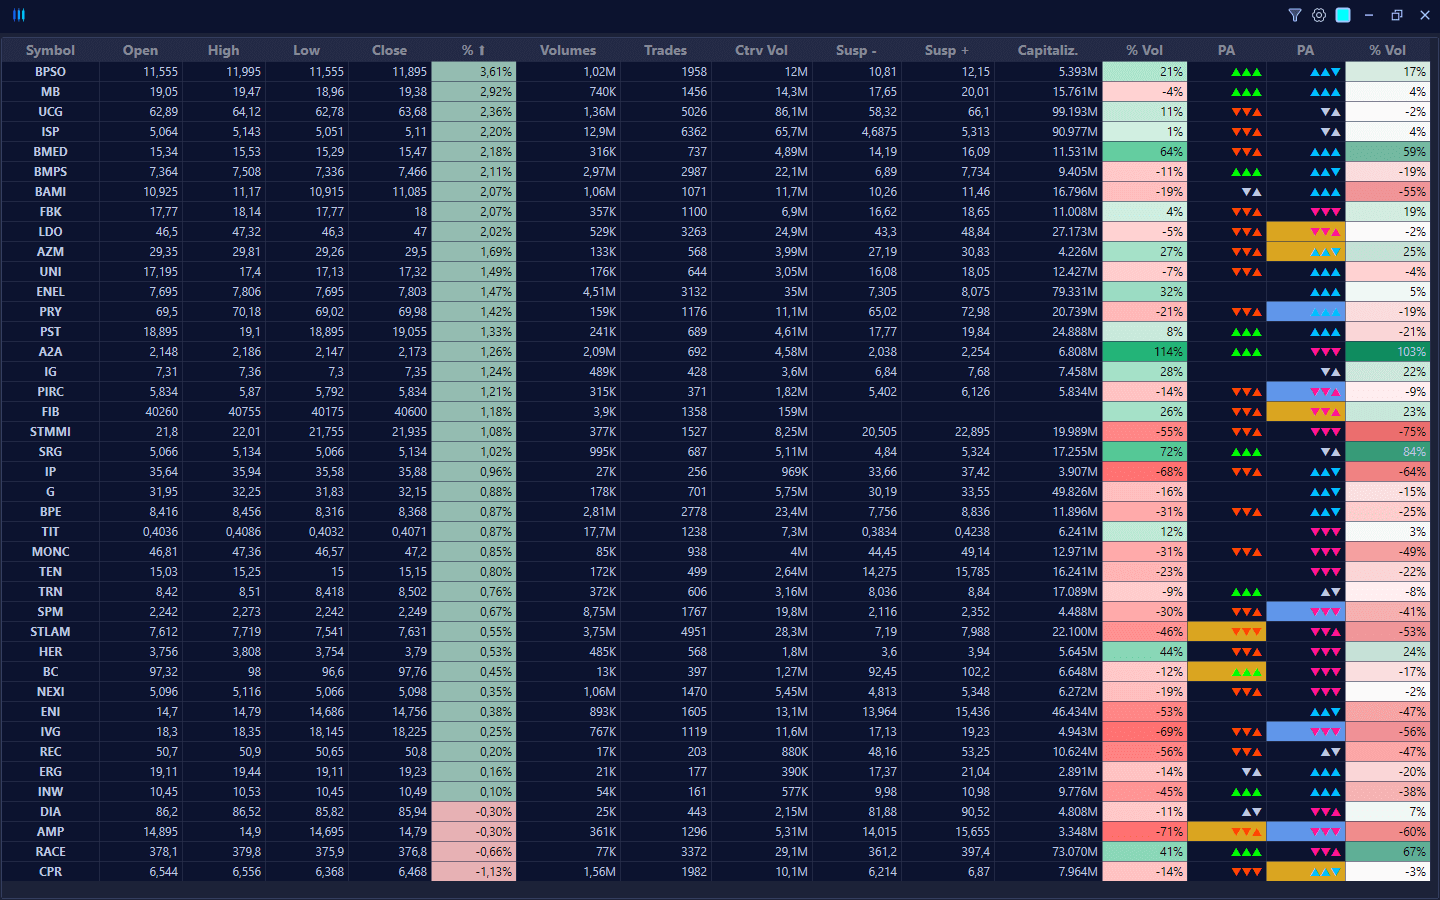
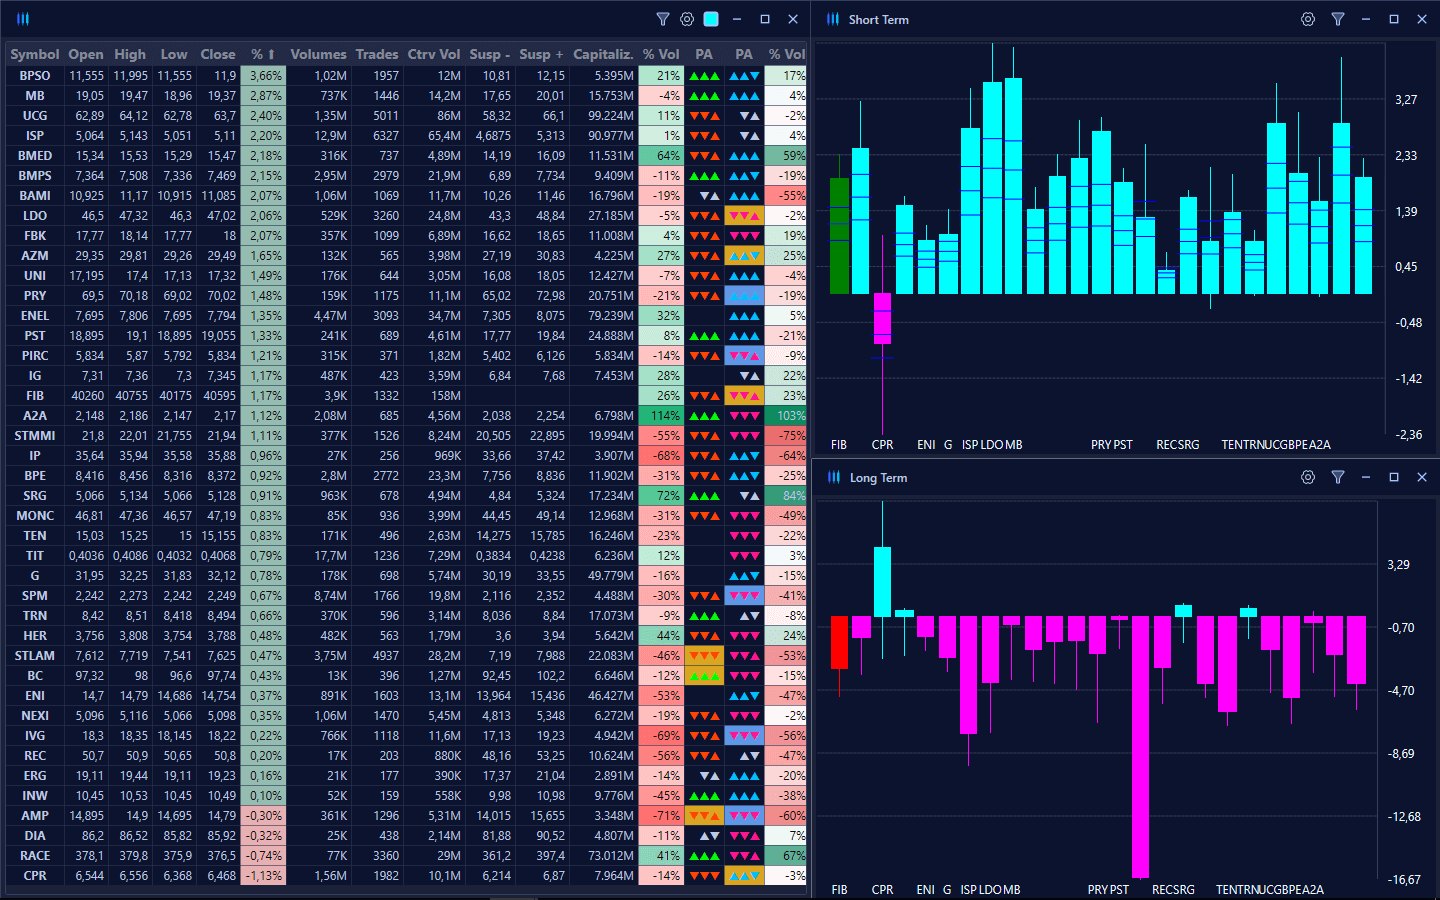
Watchlist/ScannerThe VolSys Scanner is a powerful tool for quickly identifying the hottest stocks in the market by analyzing large amounts of data in real time. It is particularly useful for identifying financial instruments that meet specific user-defined parameters based on price action and volume. In the stock market, for example, it makes it easy for you to find out which stocks are performing better or worse, or which are experiencing the highest or lowest trading volumes. The VolSys Scanner also offers the ability to add different time resolutions to which you can apply indicators such as moving averages, price action indicators, and other advanced tools. This gives you an advantage in identifying trading opportunities.Start now
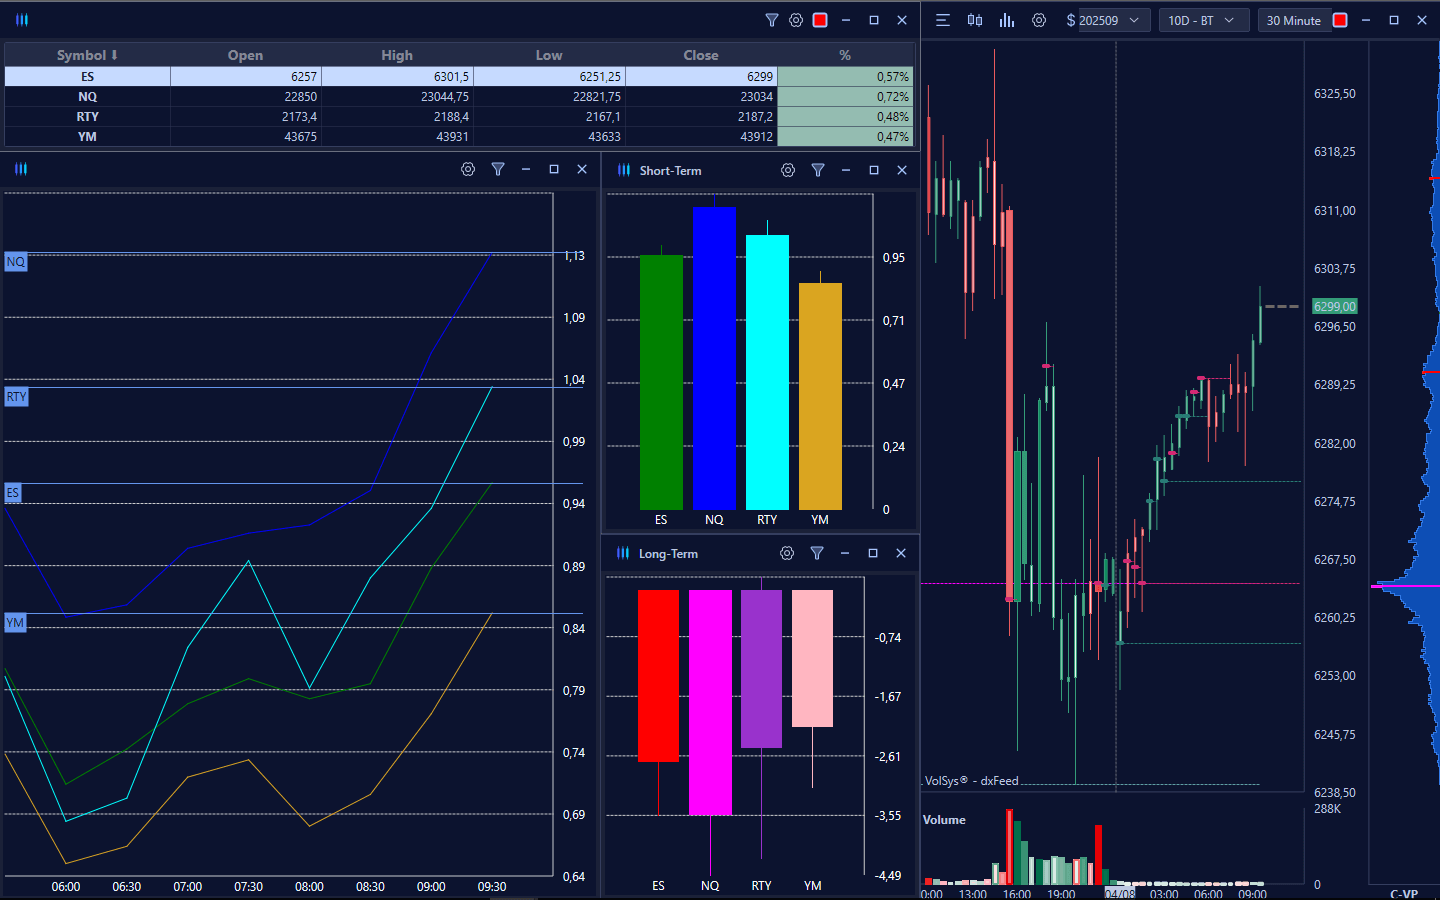
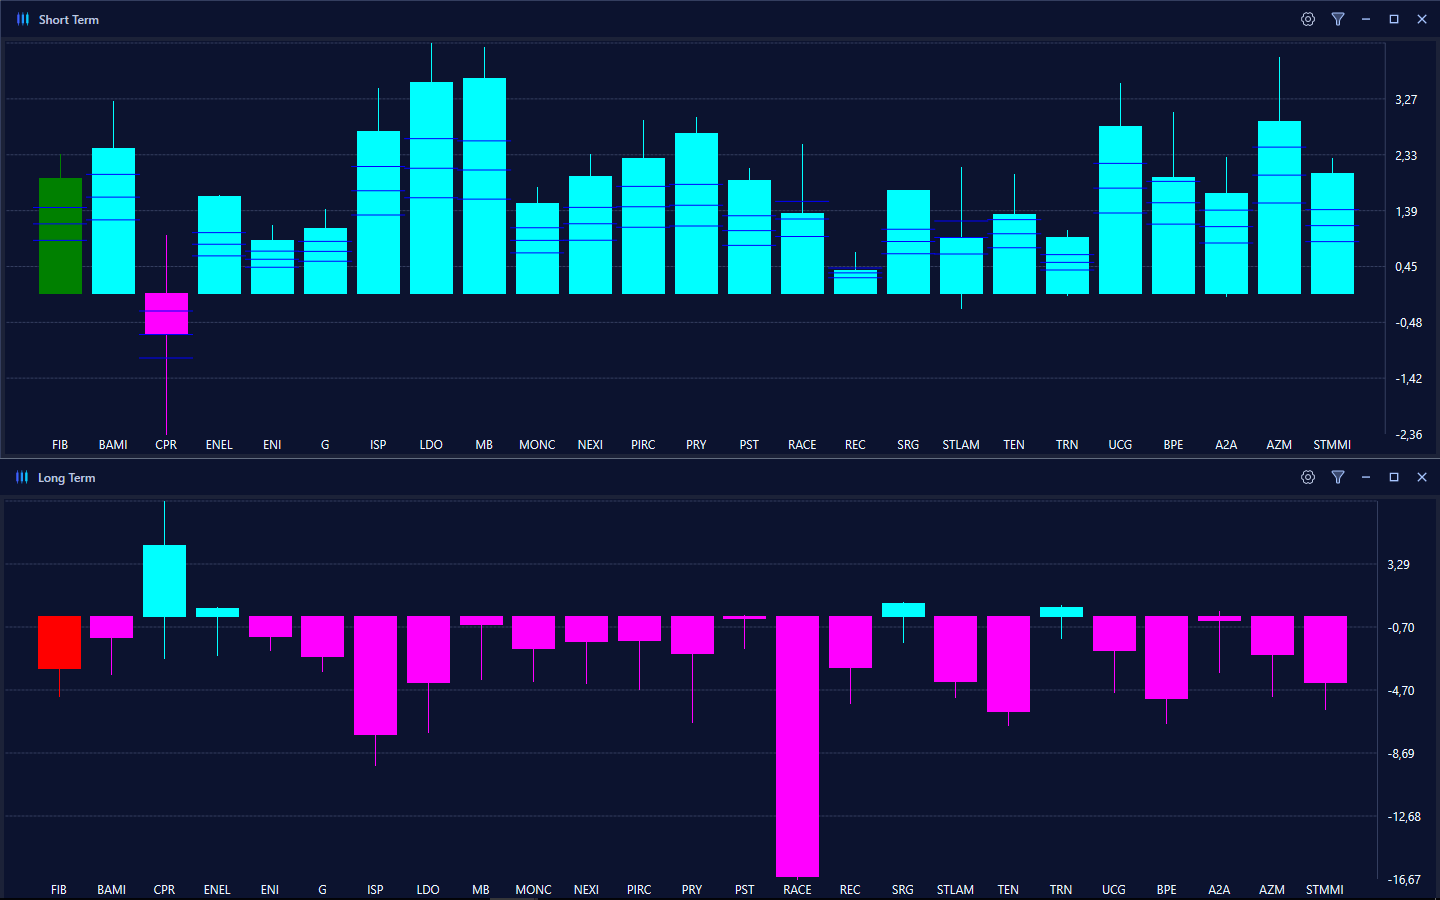
Correlation ViewerIt analyzes the trend of multiple instruments and quickly identifies divergences and convergences. It is useful to compare markets with each other, identifying which is stronger and which is weaker; we have developed a tool called Correlation Viewer, which aims to correlate and compare different markets, getting an immediate view of their strengths. The user can select various time intervals, from short to long term, to get a complete picture of the instruments being analyzed.Start now
Order Execution
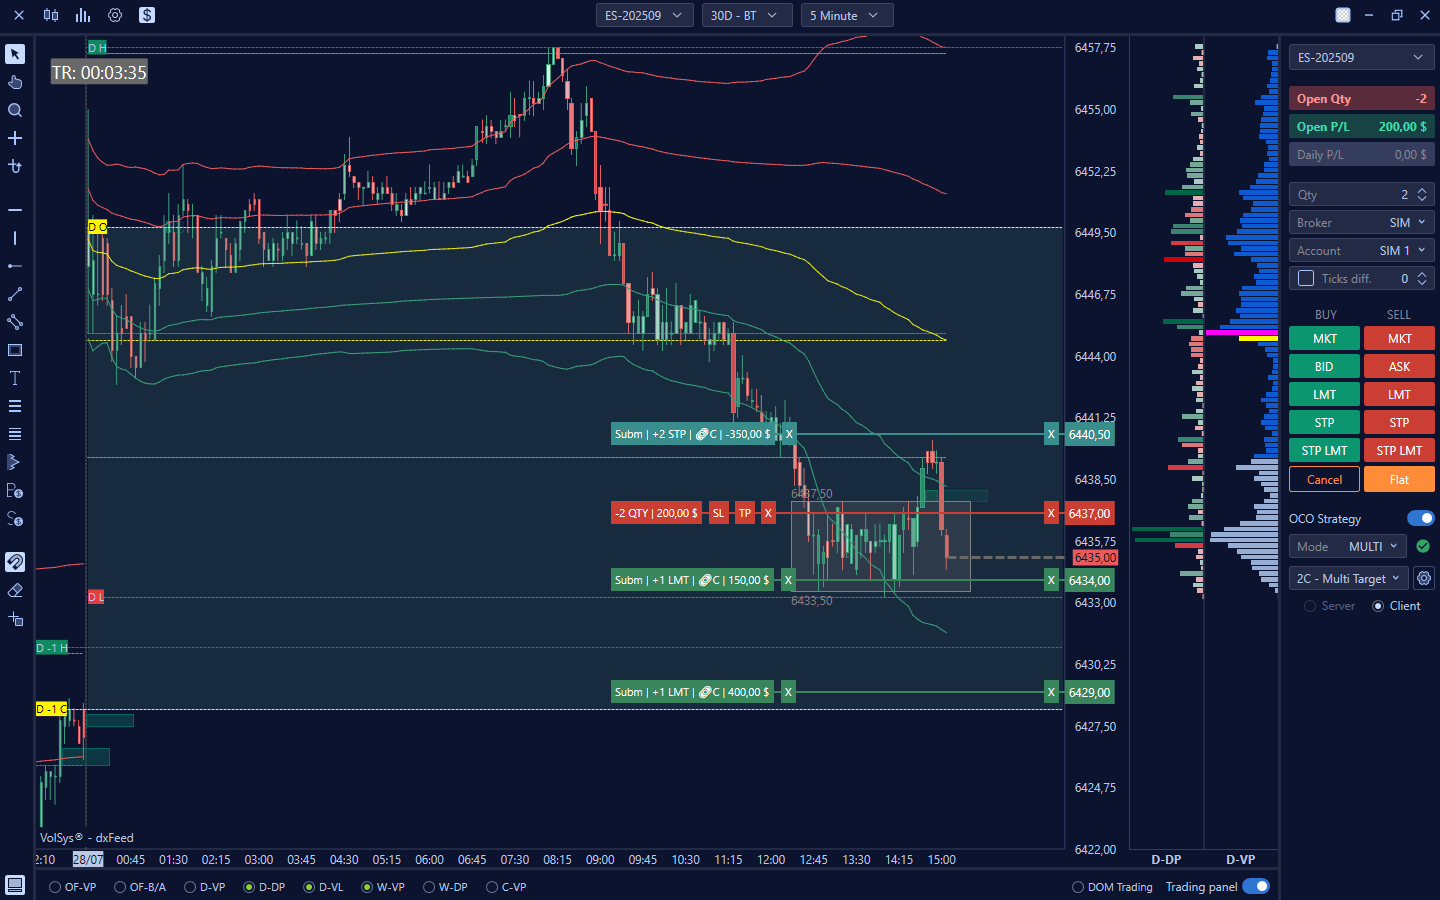
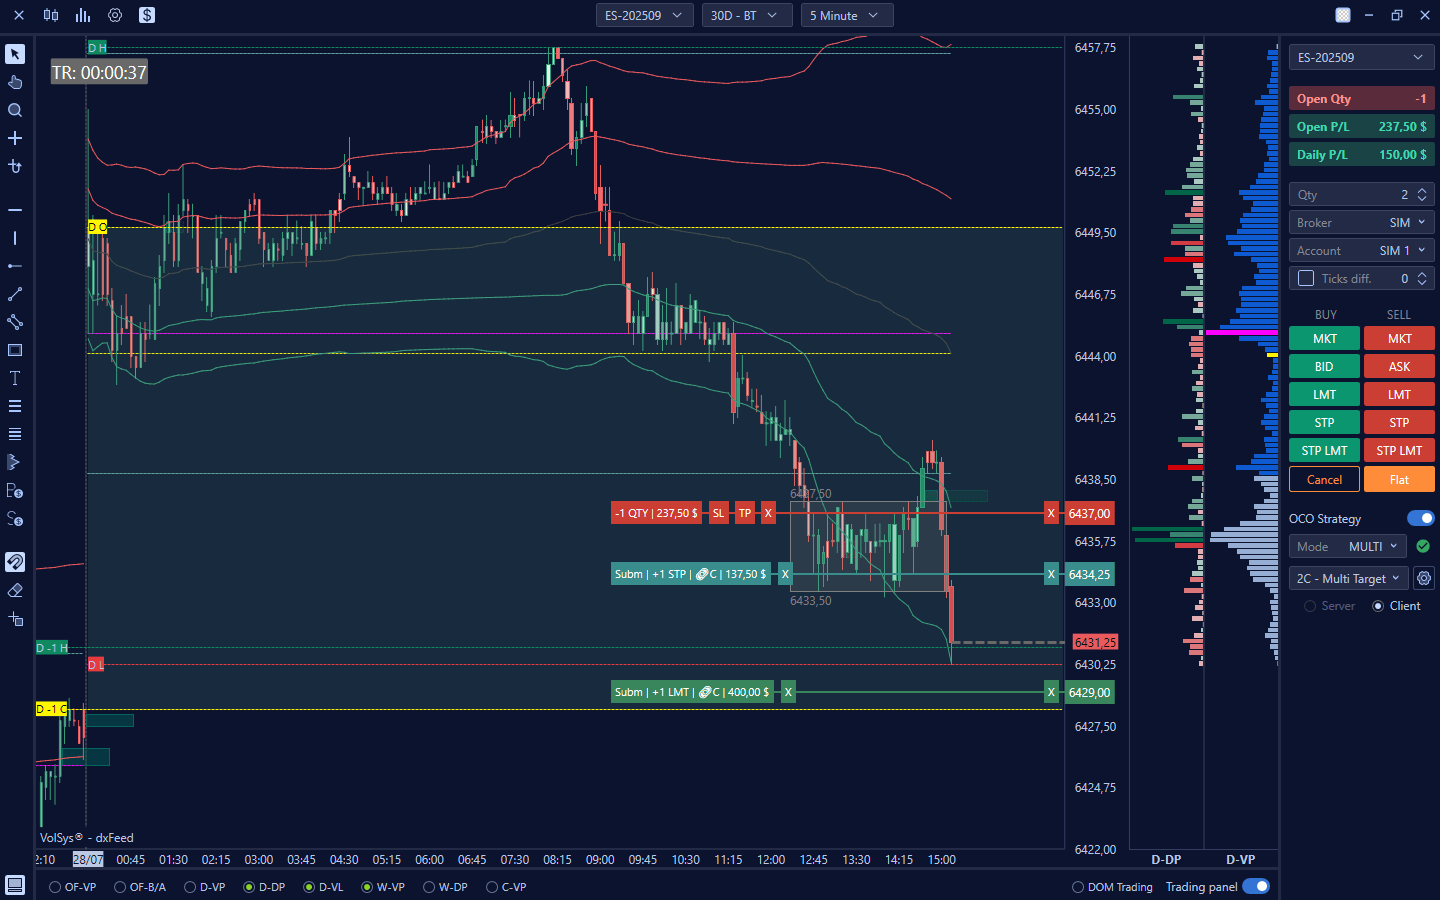
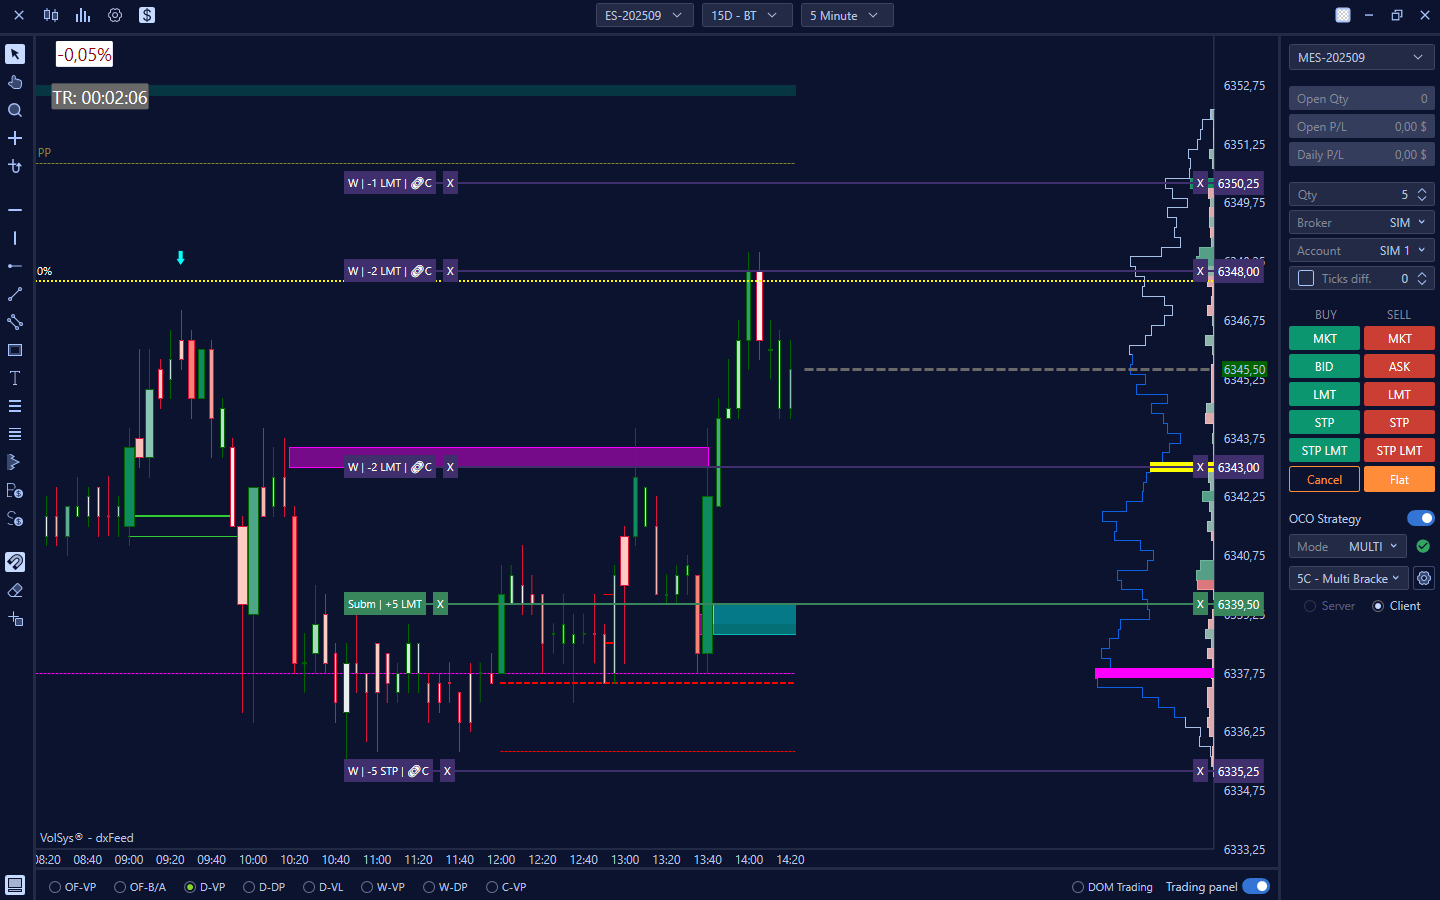
Chart TradingTrade directly on the chart quickly and easily. To help scalpers, we have come up with a tool called Chart Dom, which is a vertical book directly on the chart; it not only offers dispositive functions, but also allows you to place limit orders (left click of the mouse) and market orders (right click of the mouse) with a single click.Start now
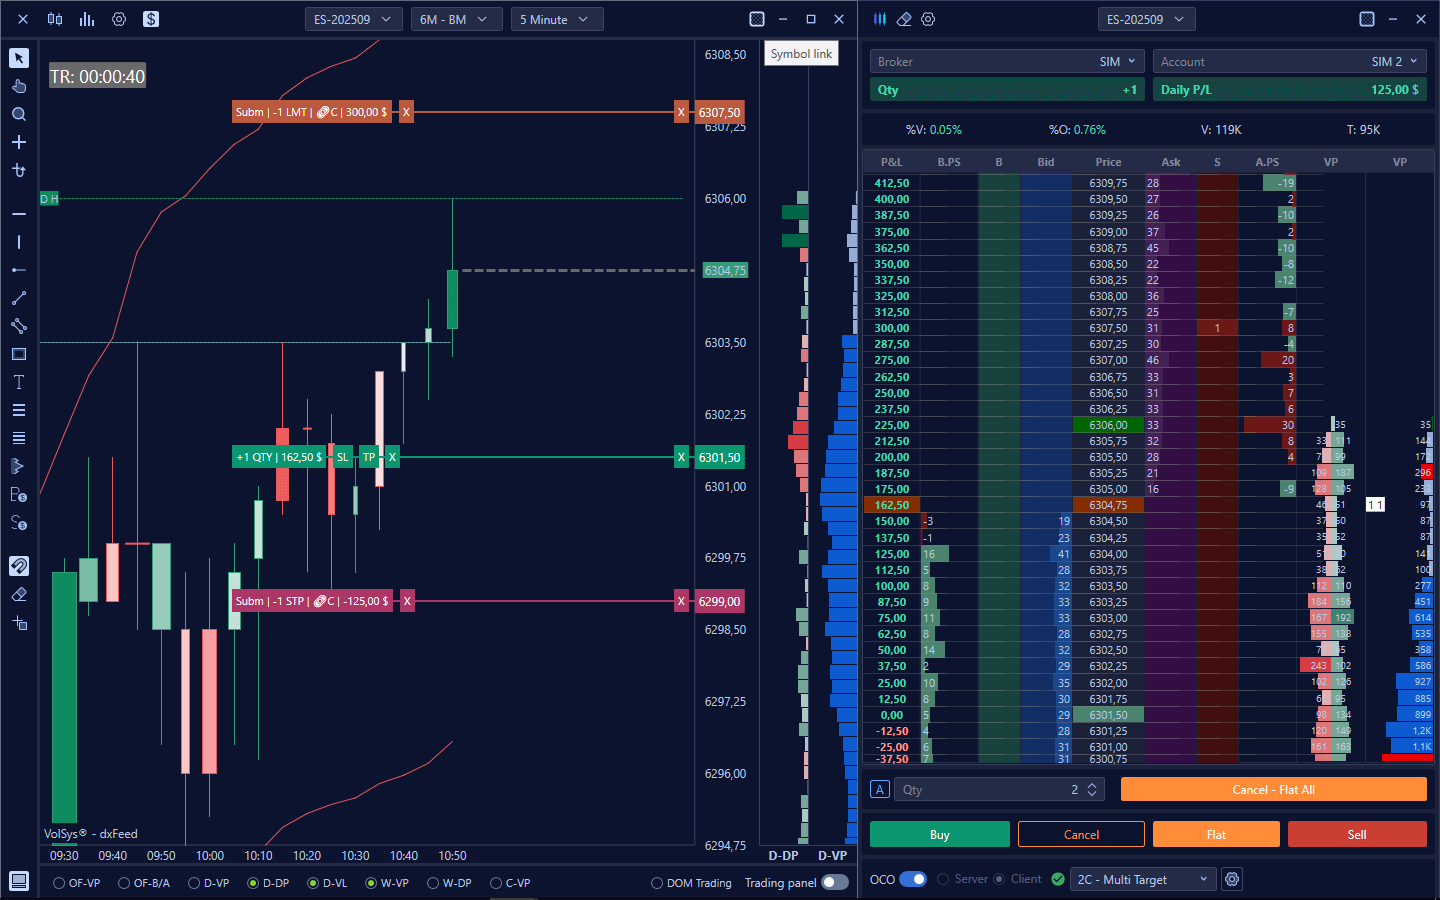
Trading panelAn intuitive and responsive tool that allows you to enter, modify and manage orders with maximum efficiency. It supports market, limit, stop, stop limit and OCO strategies orders offering complete control over execution directly from the chart or dedicated window.Start now
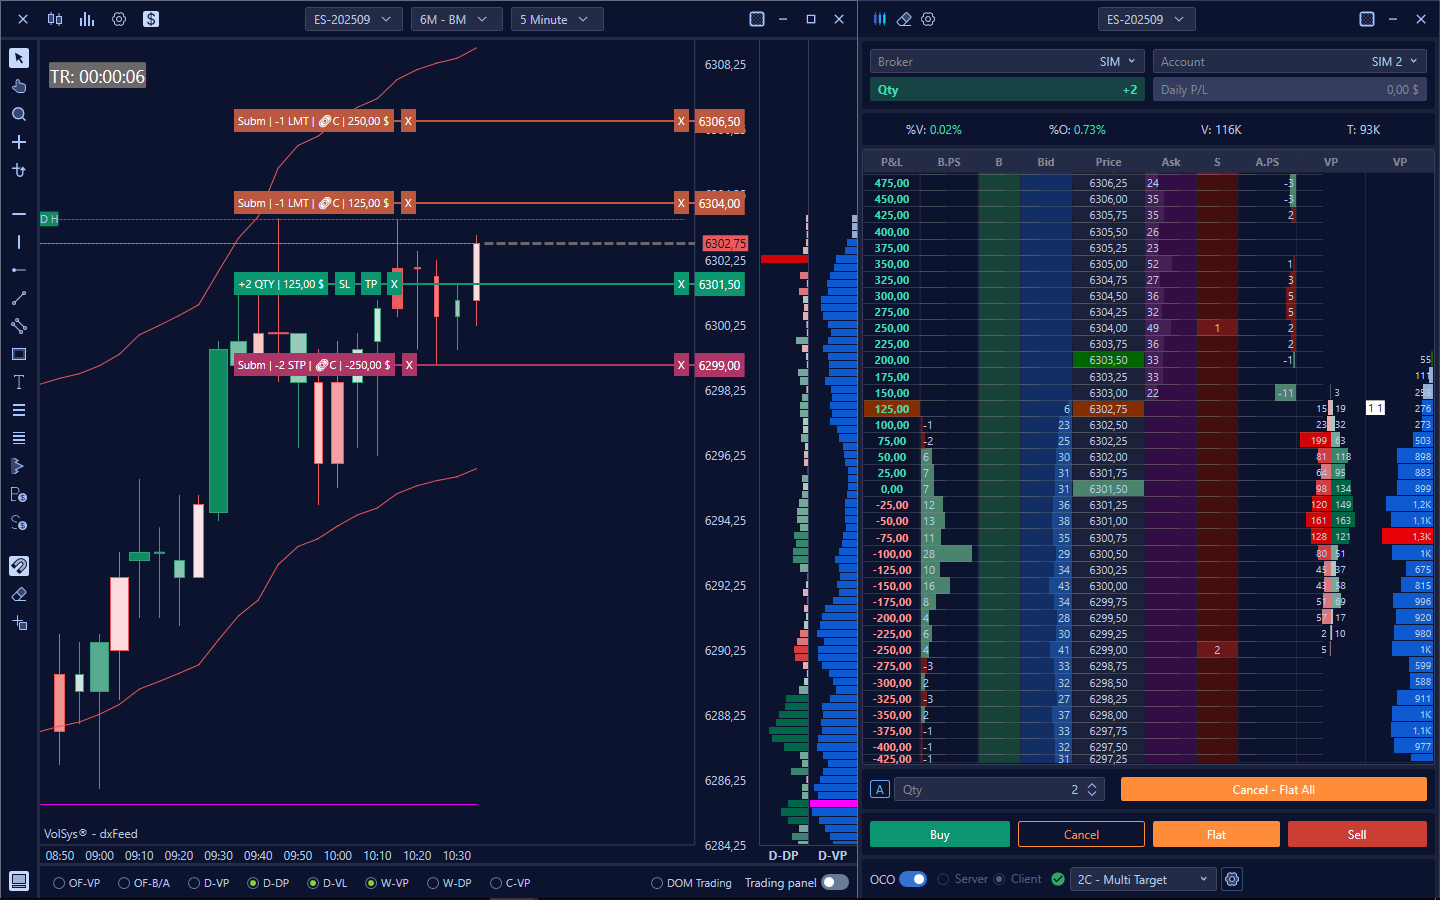
Trading from bookAllows orders to be entered directly into the Buy or Sell column of the DOM, using the left or right mouse button. The order type depends on the position of the click relative to the current market price. Offering the ability to move and cancel orders with a simple click. In addition, the quantity traded can be changed using the drop-down menu provided.Start now
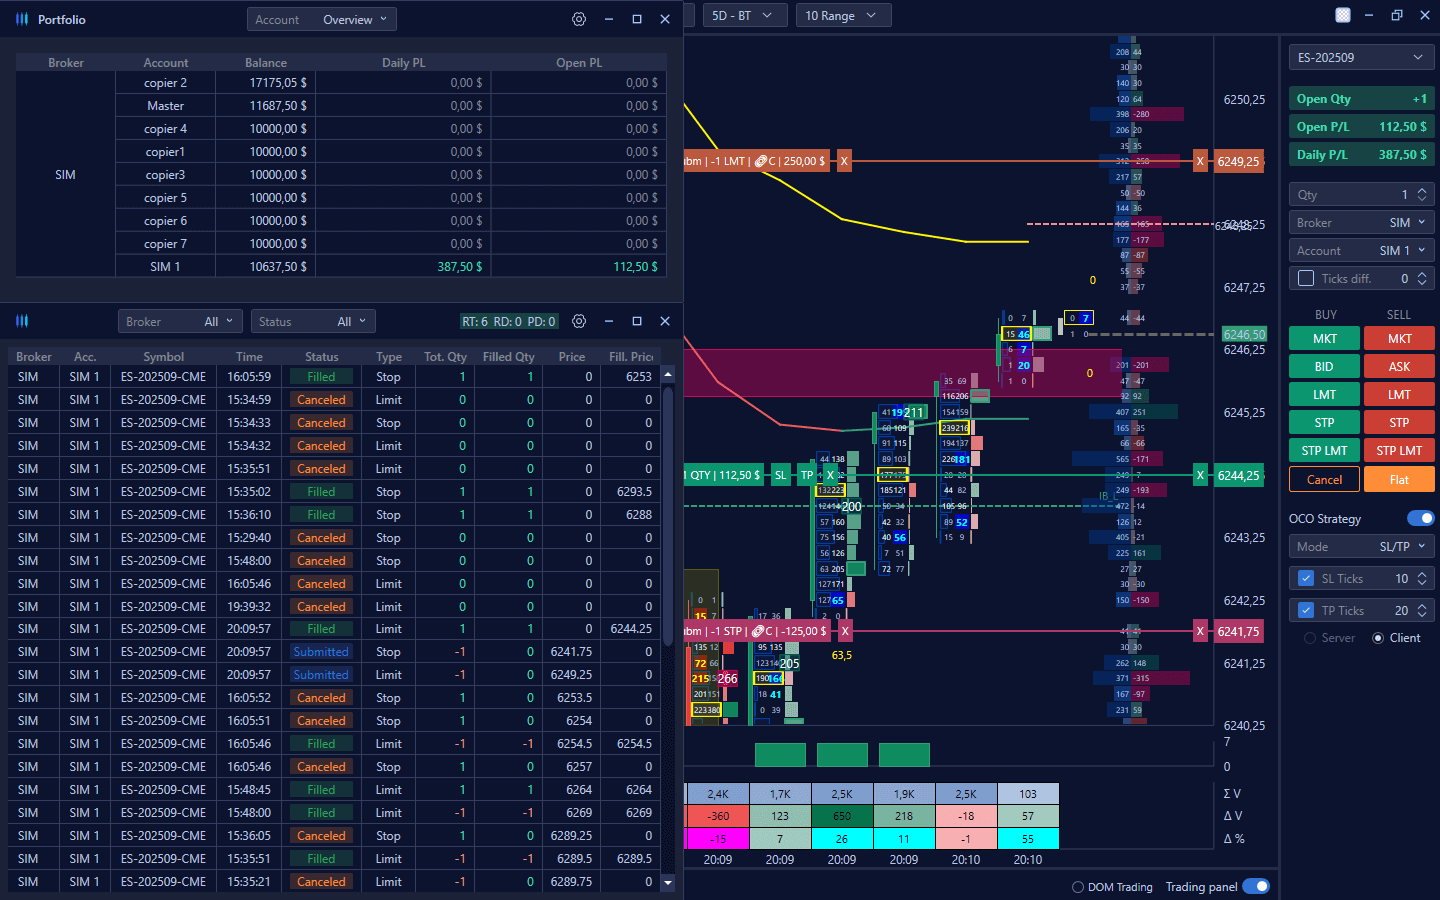
Order panel and active positionsMonitor all open orders and active positions in real time in one intuitive screen. Manage changes, cancellations, and closings with just a few clicks, always maintaining complete control over your trades. It also allows you to view a list of executions by individual broker or overall.Start now
Book
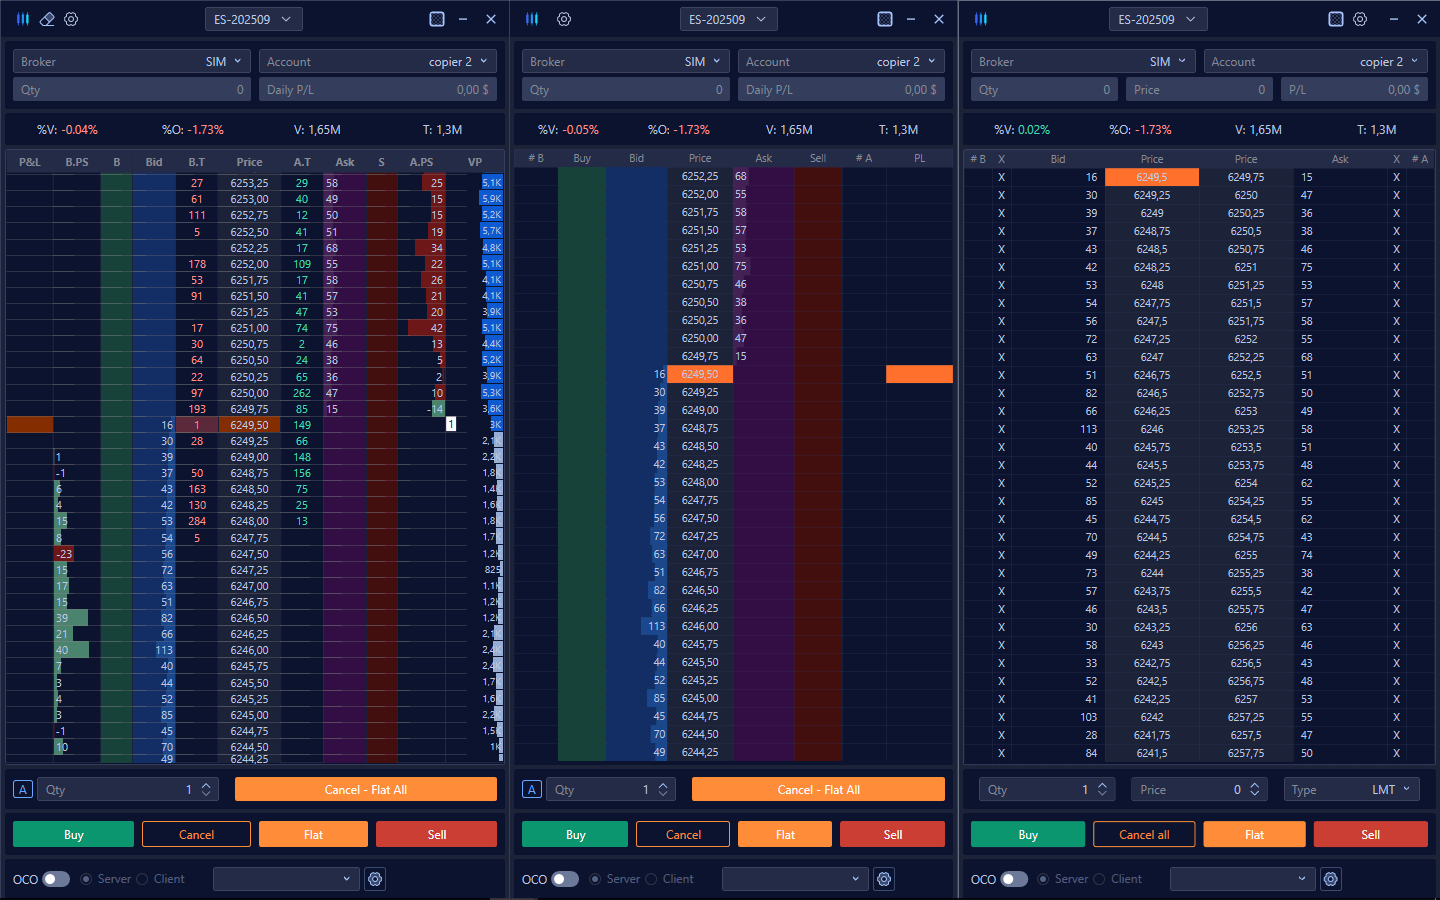
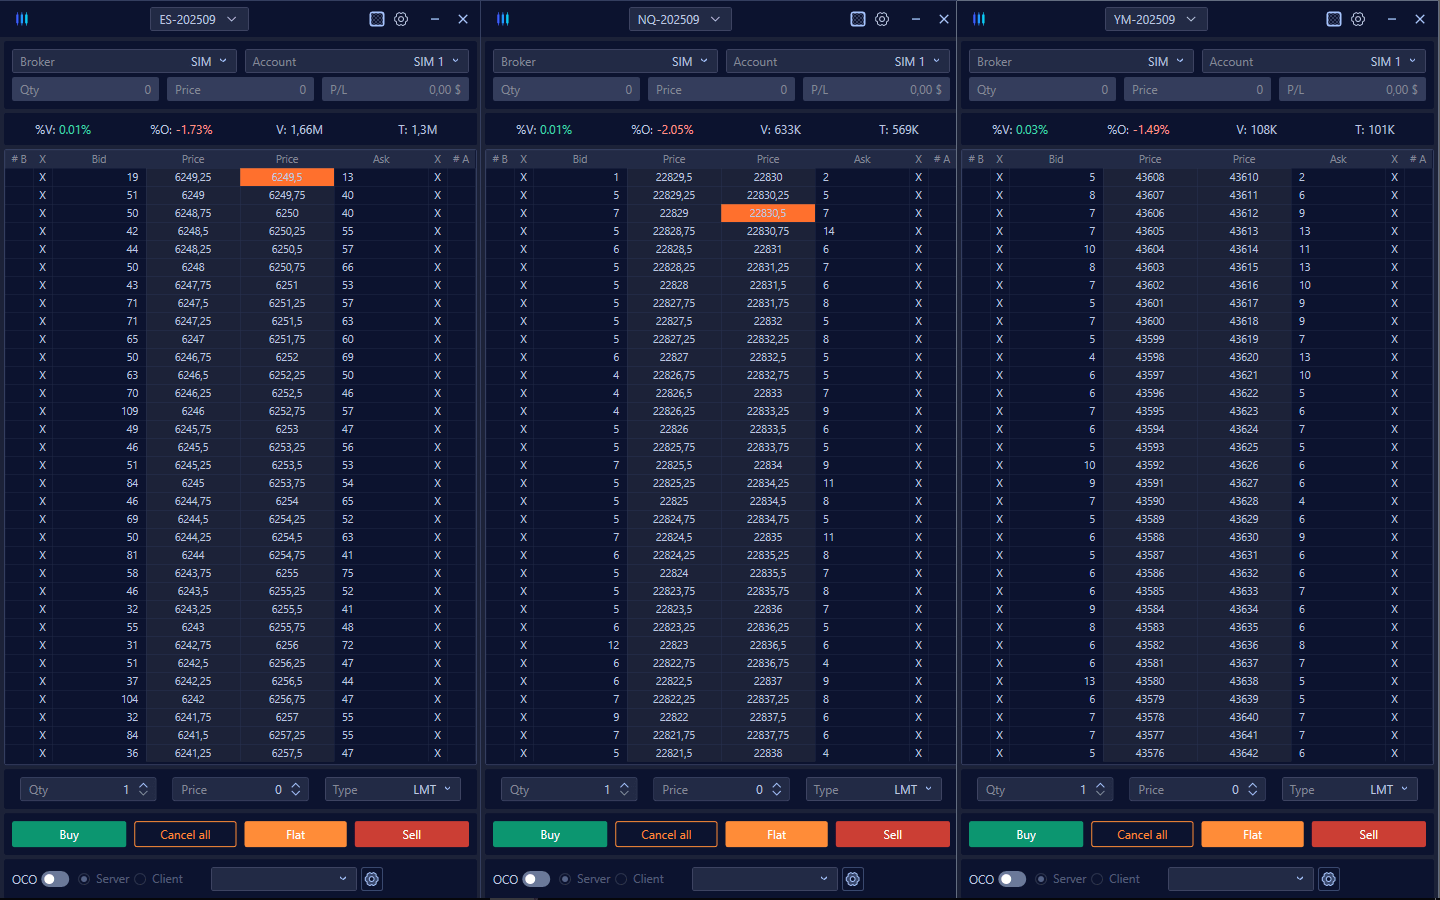
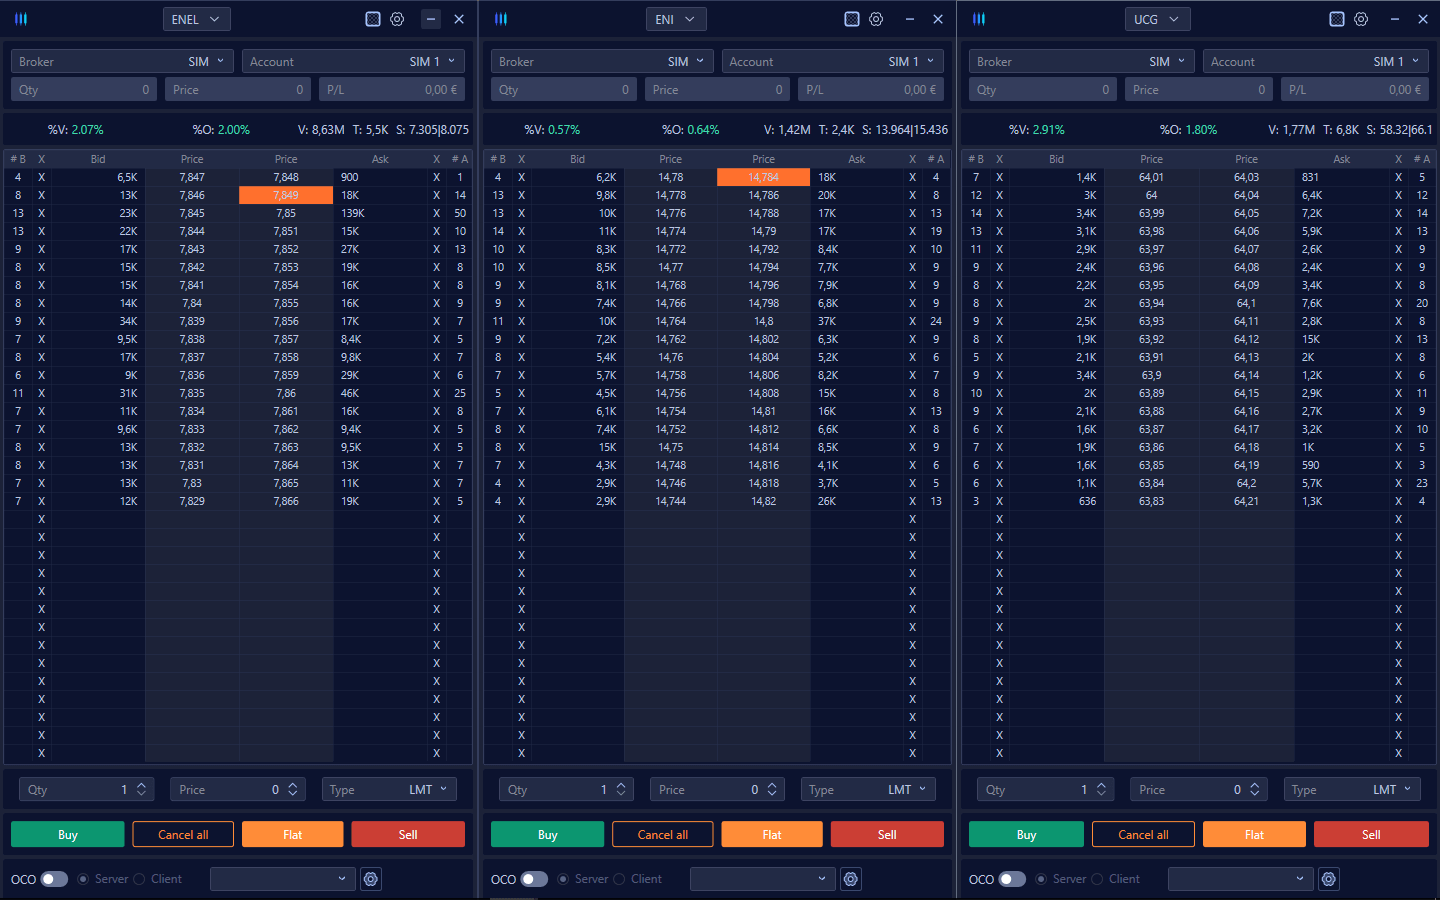
Type of bookThe Trading Book, also known as DOM (Depth of Market), is an essential tool for market analysis, as it allows you to view in real time the buy (Bid Side) and sell (Ask Side) limit orders distributed over the different price levels. In Volsys it is possible to choose from three different types of books: horizontal, vertical and advanced.Start now
Horizontal BookThe horizontal book is a representation of the trading book in which price levels are arranged horizontally, from left to right. Each price corresponds to the amount of limit orders present, divided between bid (buy) and ask (sell) side. This format provides an immediate visualization of market depth and supply-demand imbalances.Start now
Vertical BookVolSys' Vertical DOM has the unique feature of being able to compress ticks, viewing only the price levels where there are orders placed, facilitating operations especially in thinner equities, avoiding the user having to make long vertical scrolls. Includes Up/Down Tick functionality, which shows ticks before and after those with proposed quantities to facilitate order placement, and Front Tick, which shows only the previous tick.Start now
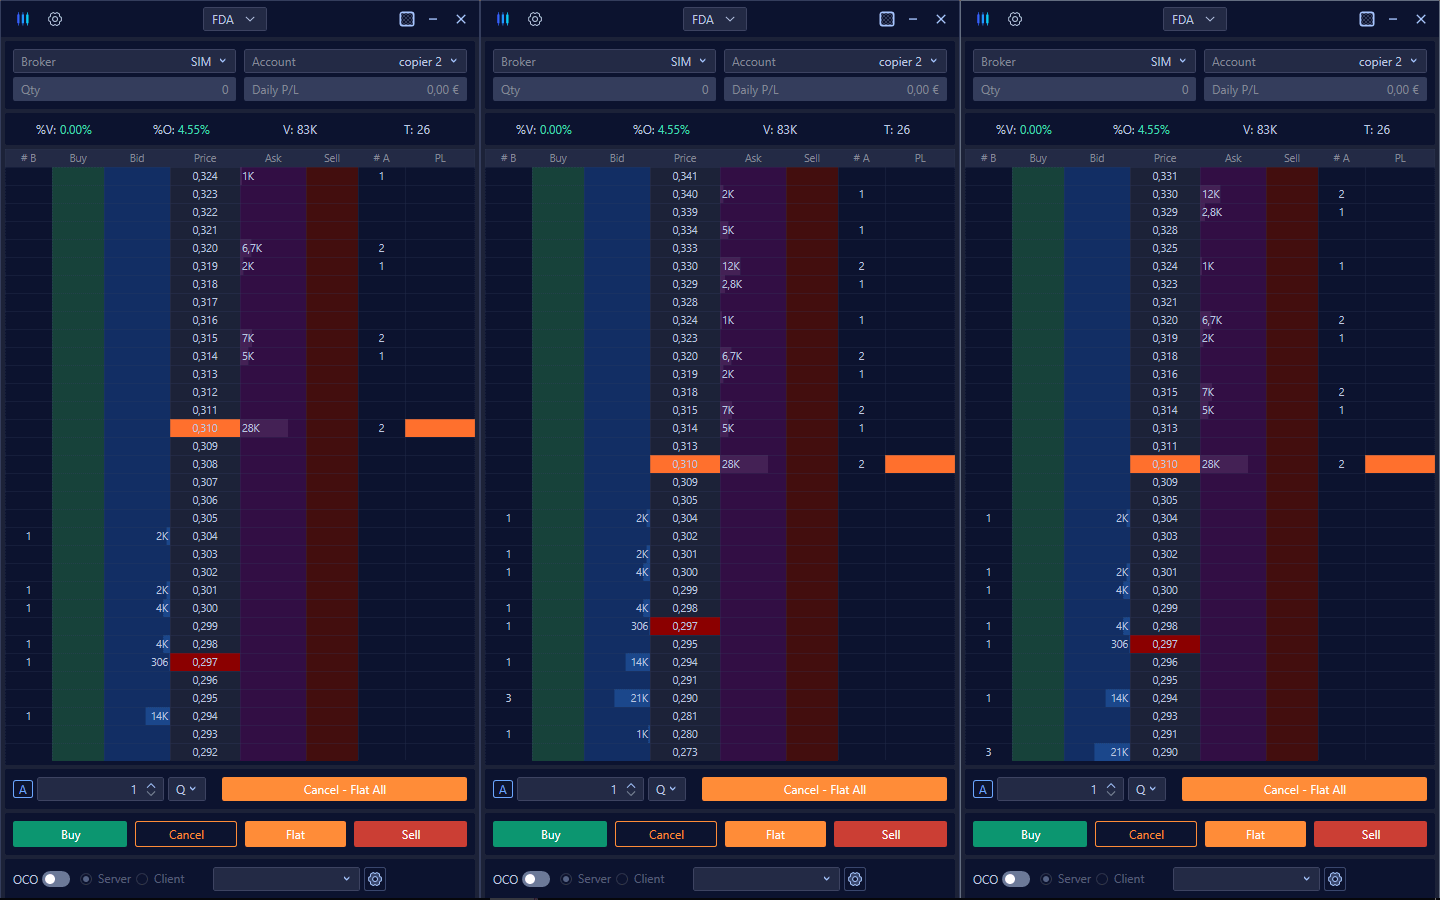
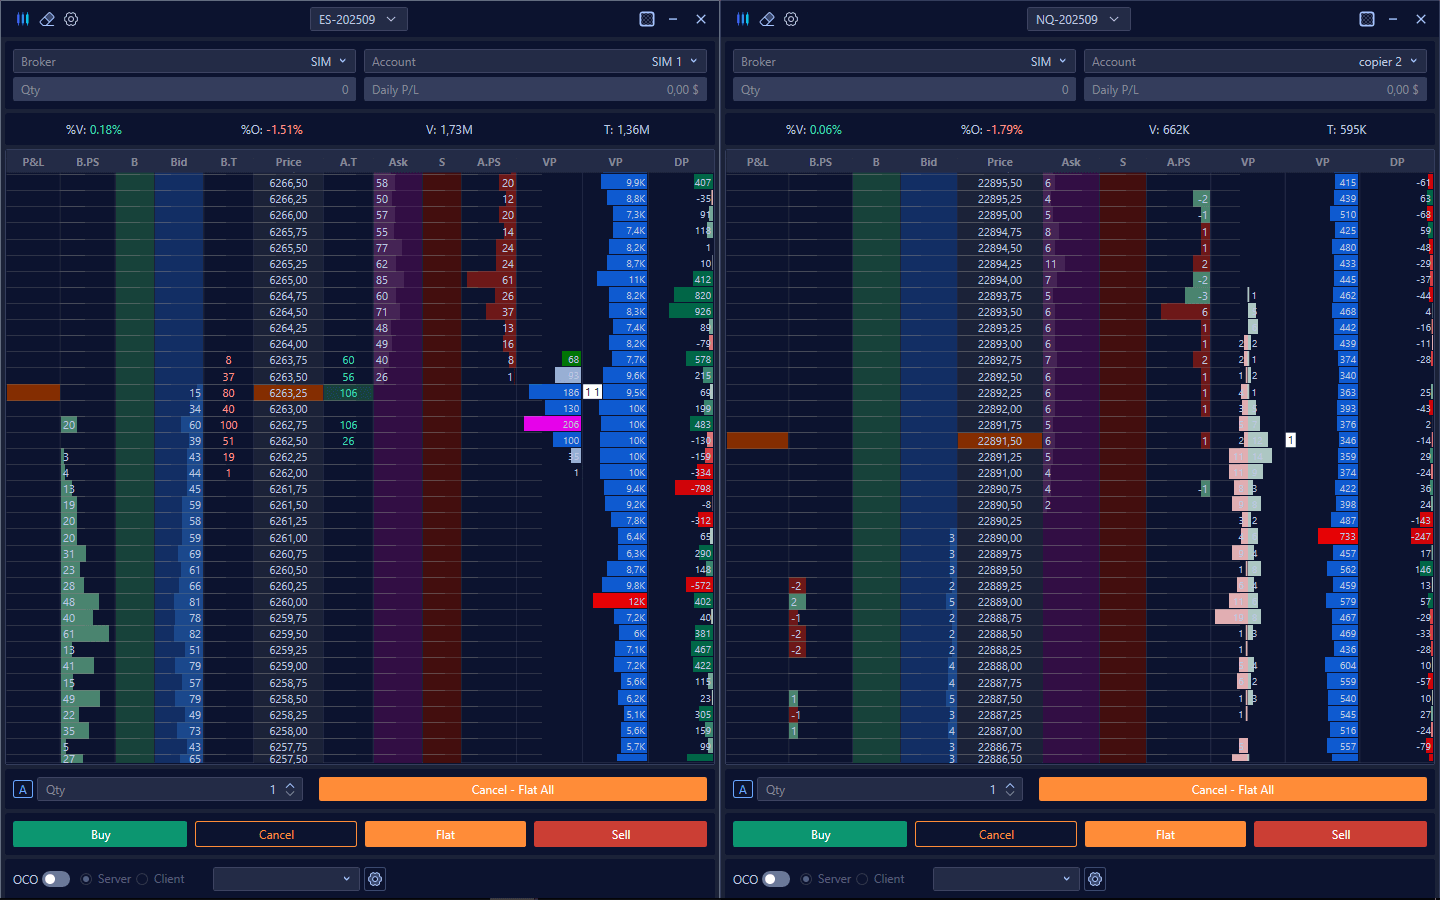
Advanced BookVolSys' Advanced DOM goes beyond the functionality of a traditional vertical DOM, providing a more detailed view of order dynamics. In addition to the simple representation of market depth, it allows accurate monitoring of quantities added or removed on each price level. This advanced feature allows for more accurate detection of any reloads or unloads by market participants, thus providing crucial information for interpreting the behavior of institutional traders and improving trading strategies based on order flow analysis. In addition, quantities executed on individual price levels can also be displayed, so that information on buying and selling pressure is always at hand.Start now
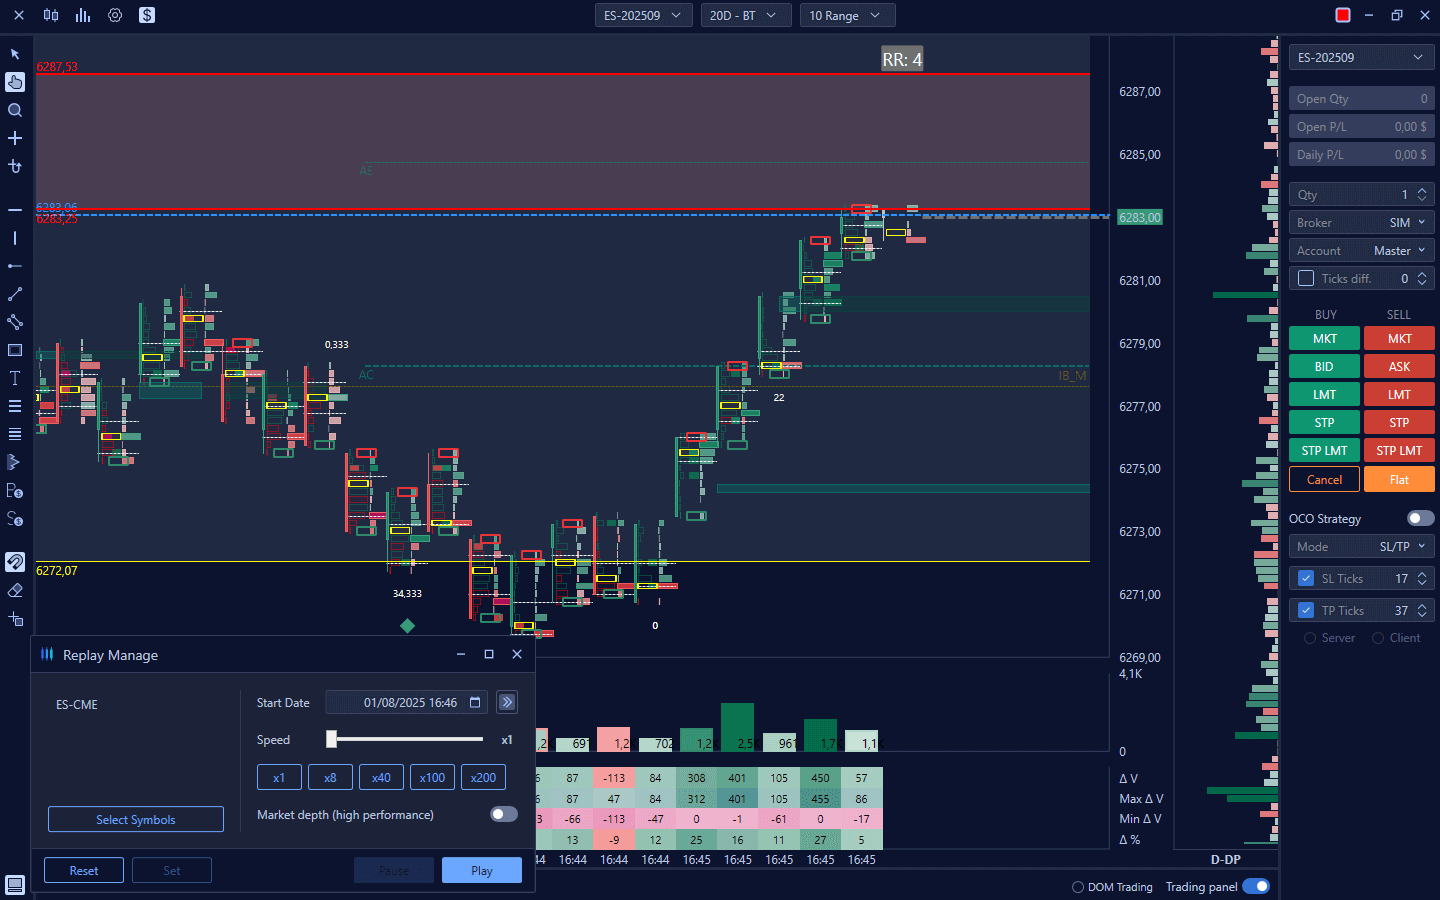
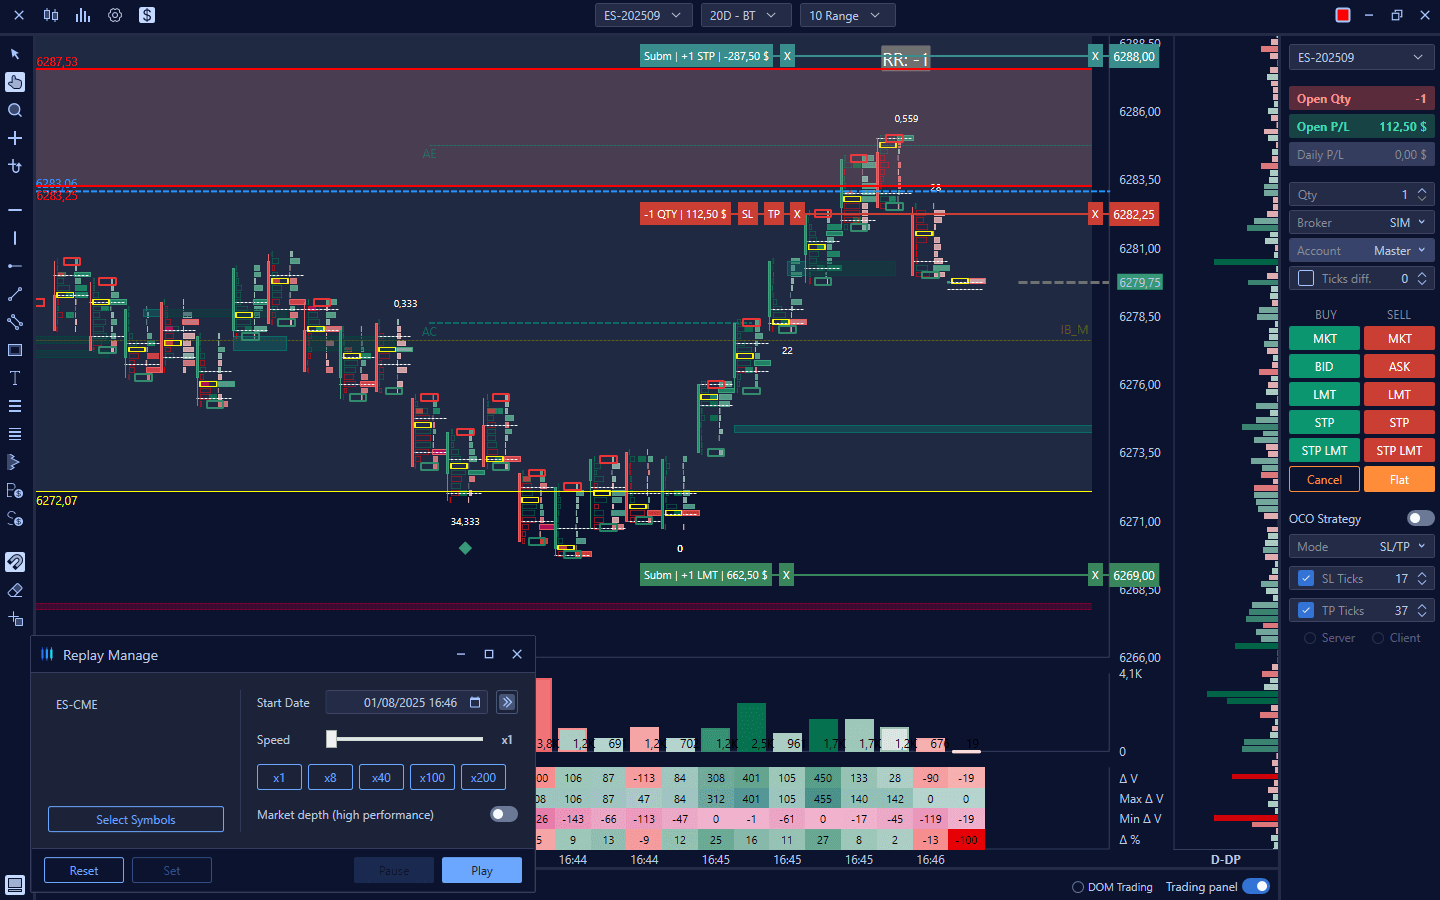
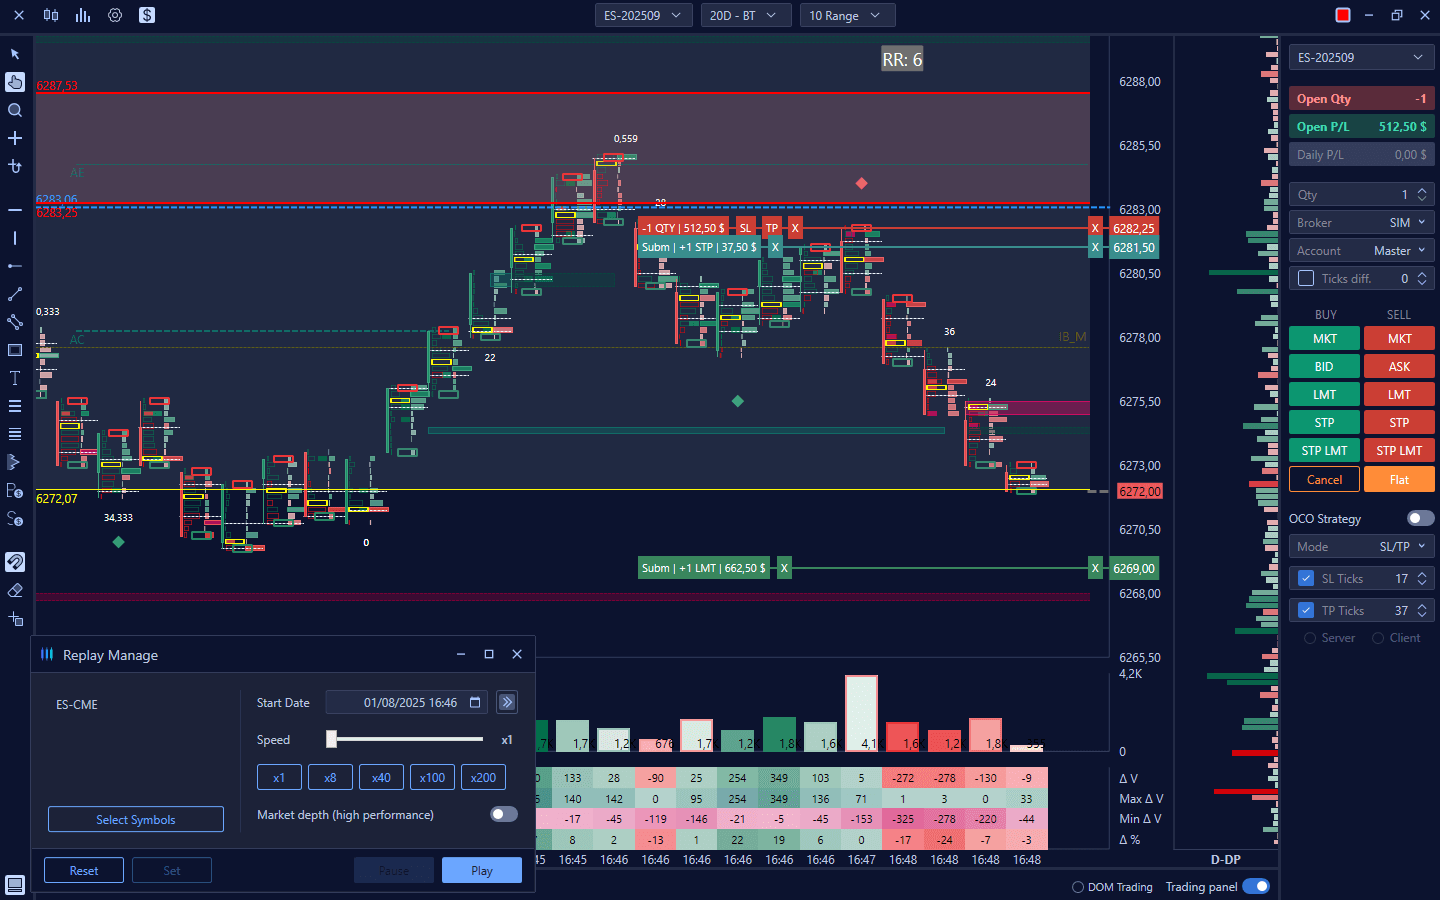
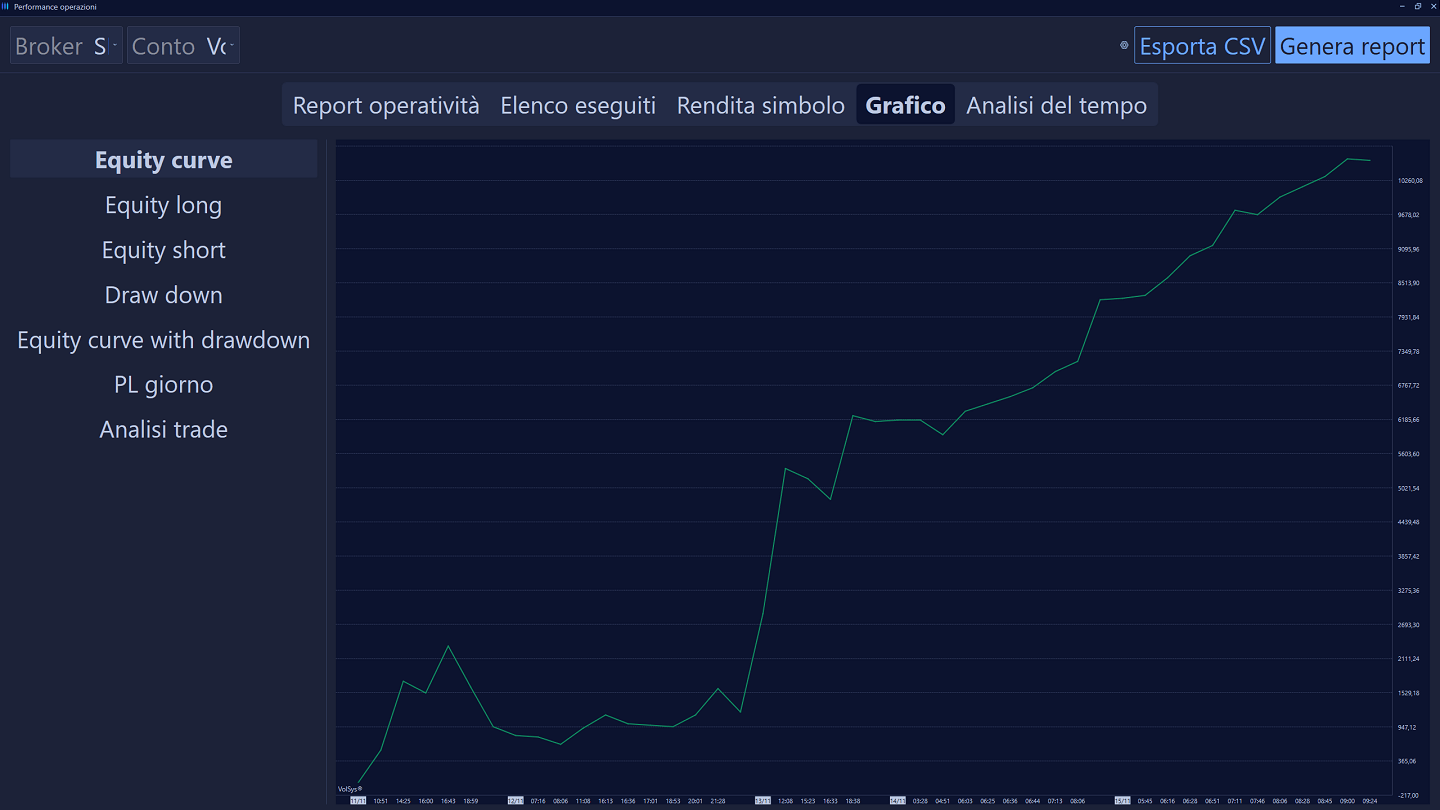
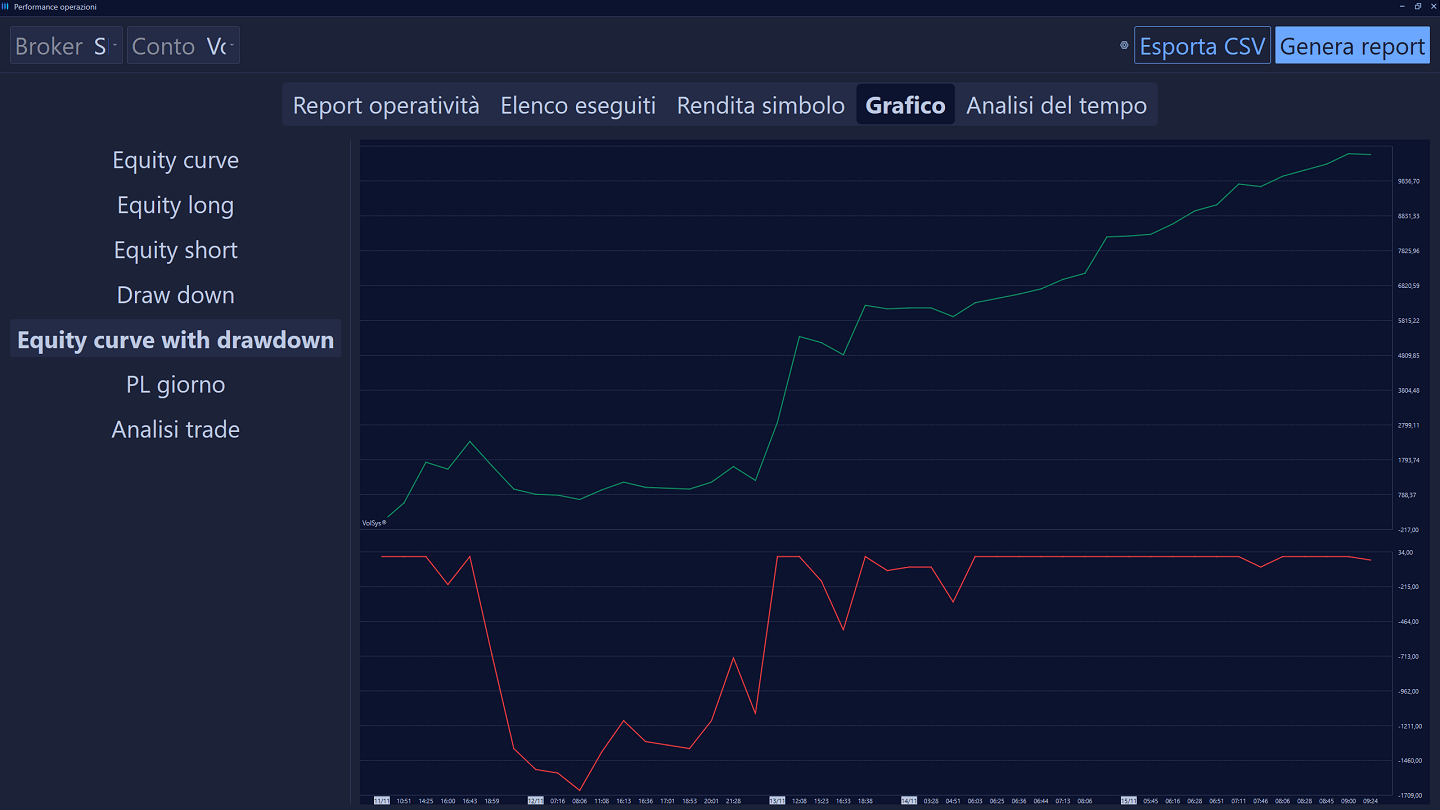
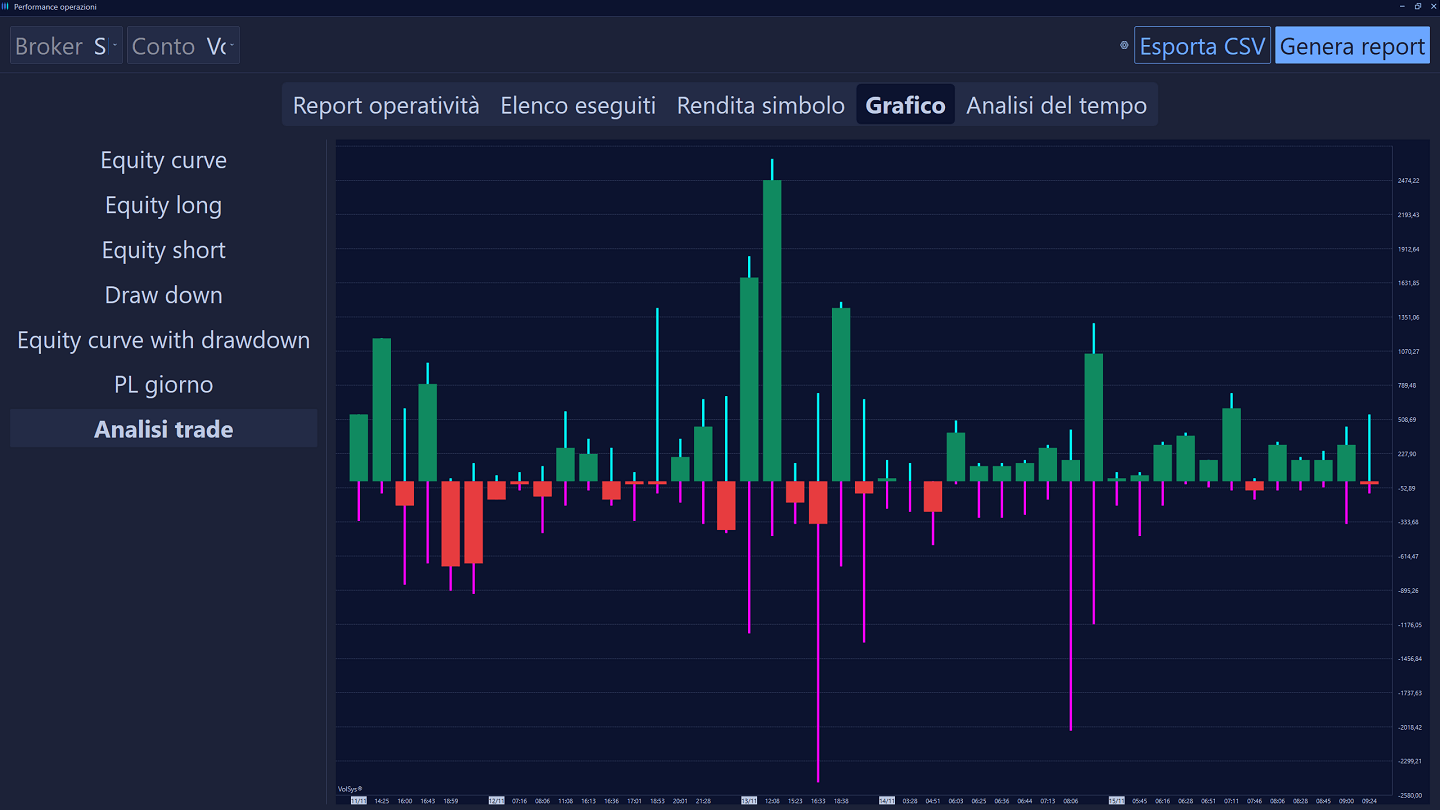
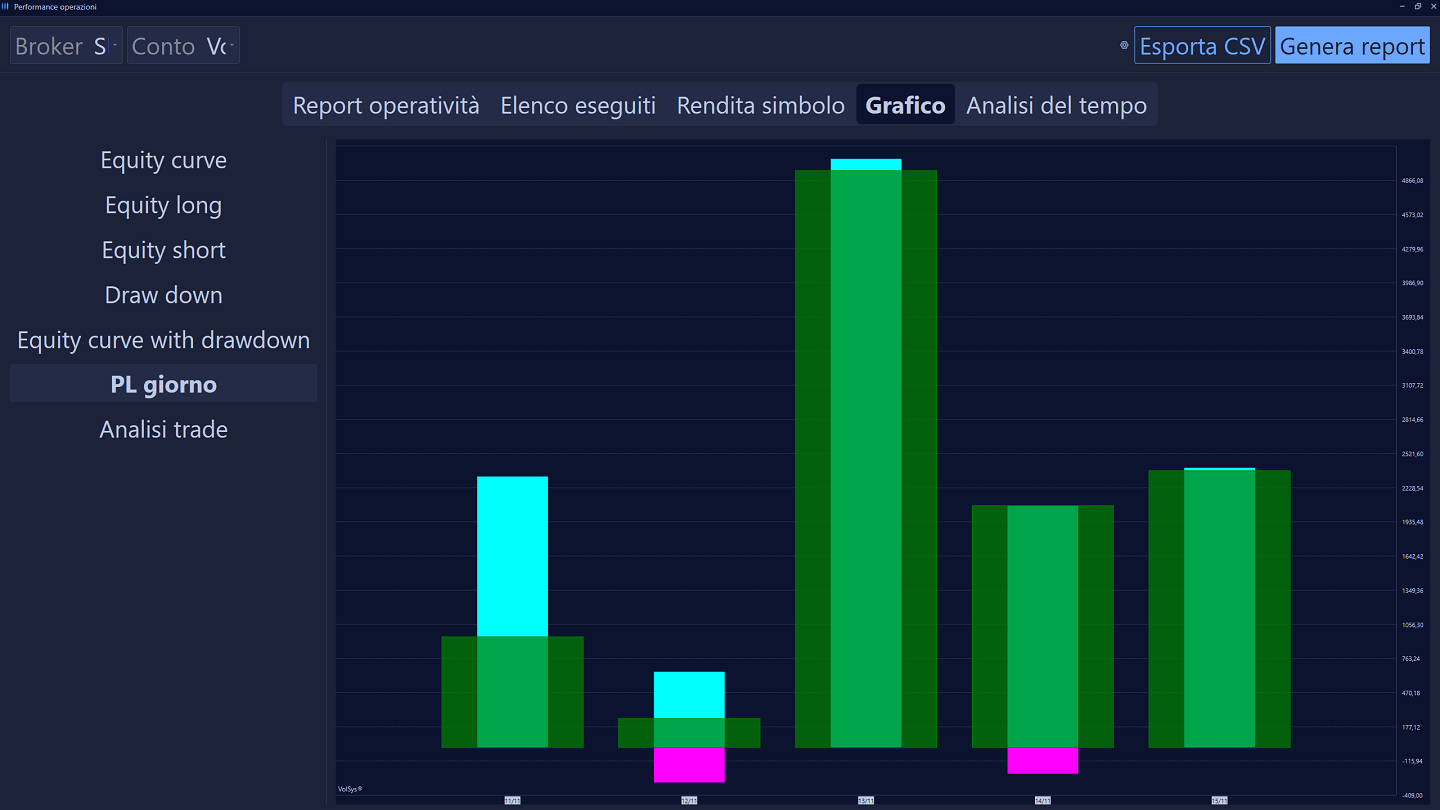
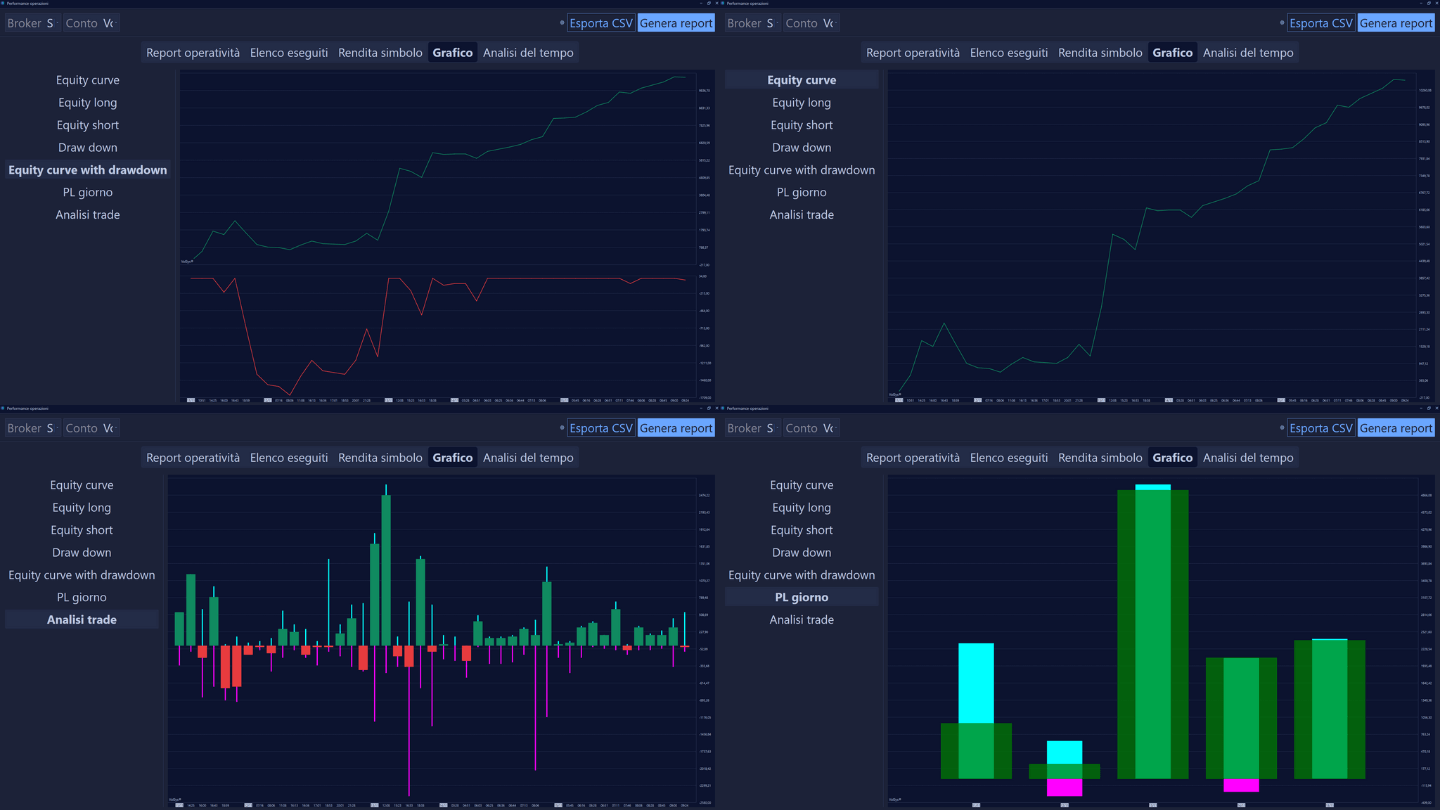
Replay tick dataThe Replay Tick Data feature allows you to relive past market sessions, tick by tick, simulating real-time observation. You can pause, rewind or speed up, controlling the time dynamics. It is great for executing trades in simulation, without risk. It is a useful tool both for beginners to familiarize themselves with order flow and for experts who want to test and refine strategies (discretionary backtest) in real scenarios, including high volatility. It also allows new instruments to be studied. At the end, a detailed report with statistics such as equity line, drawdown, percentage of winning trades, and risk/return ratio helps you objectively evaluate and improve your trading, building a solid and measurable approach to trading.
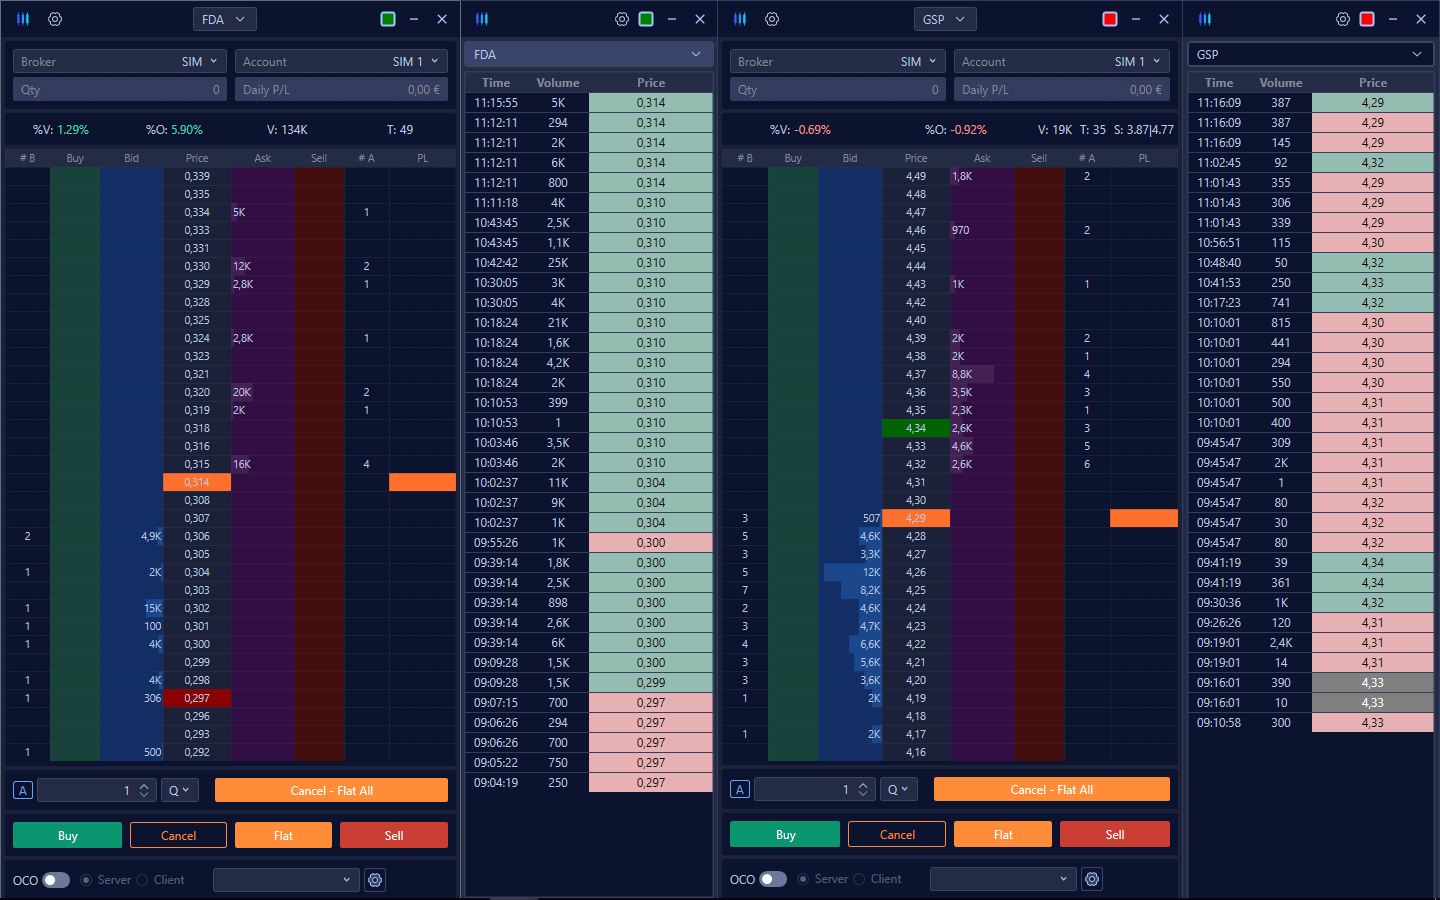
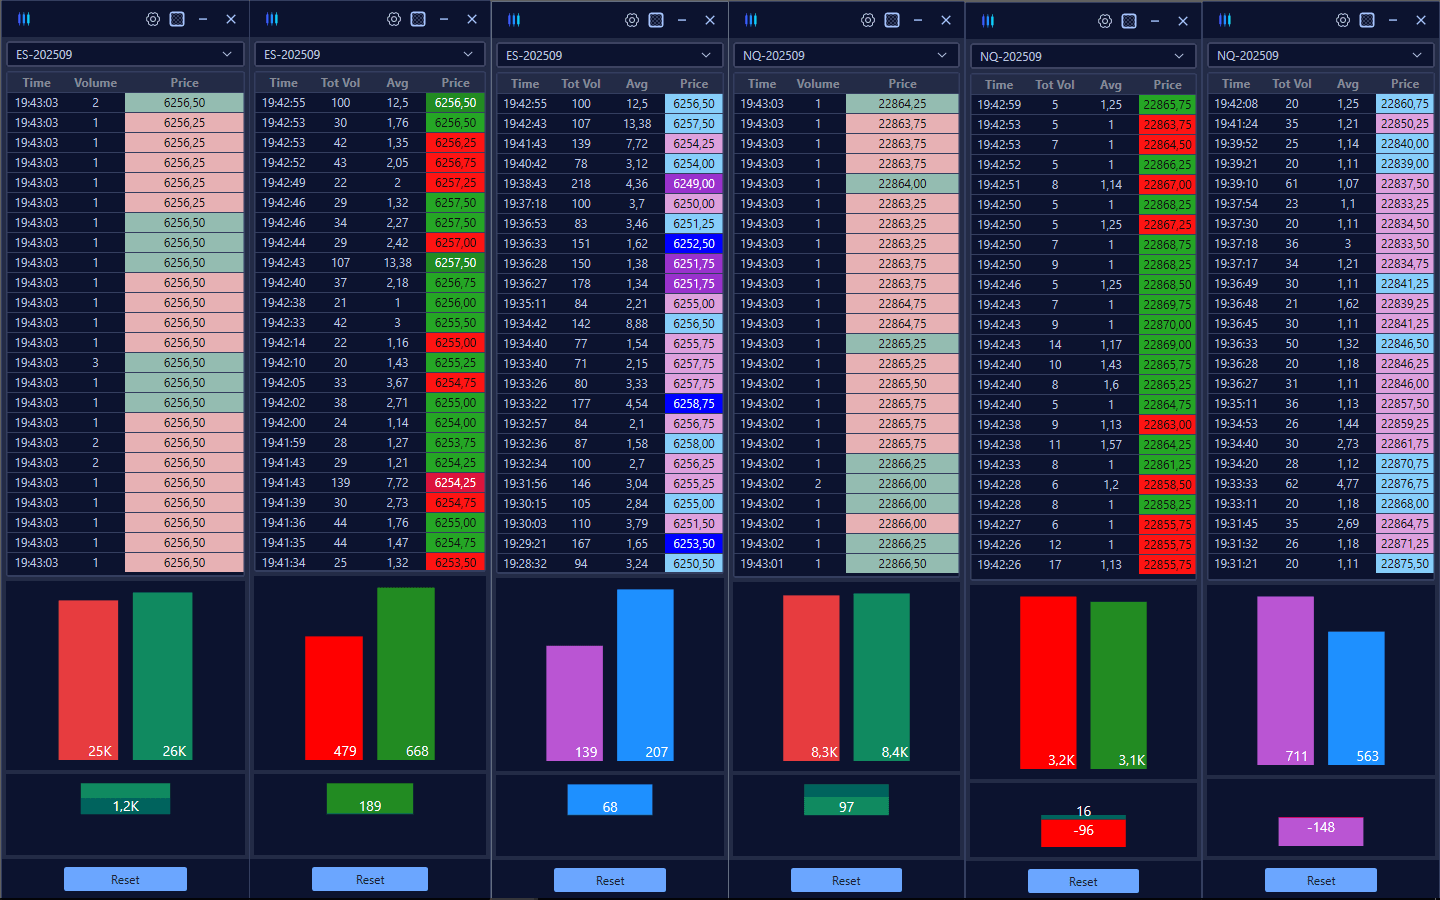
Advanced Time & SalesVolbook's Advanced Time & Sales (T&S), also known as Ticker Tape, is a key tool for monitoring real-time execution of market orders. It lists each transaction with timestamp, volume, and execution price. Color coding is a key aspect: Red indicates a market sell order that has hit a buy limit order (on the Bid), signaling selling pressure. Green indicates a market buy order that has hit a sell limit order (on the Ask), highlighting buying pressure. The Advanced T&S allows you to customize the analysis by filtering out the most relevant orders and triggering sound alerts, improving the interpretation of order flow.
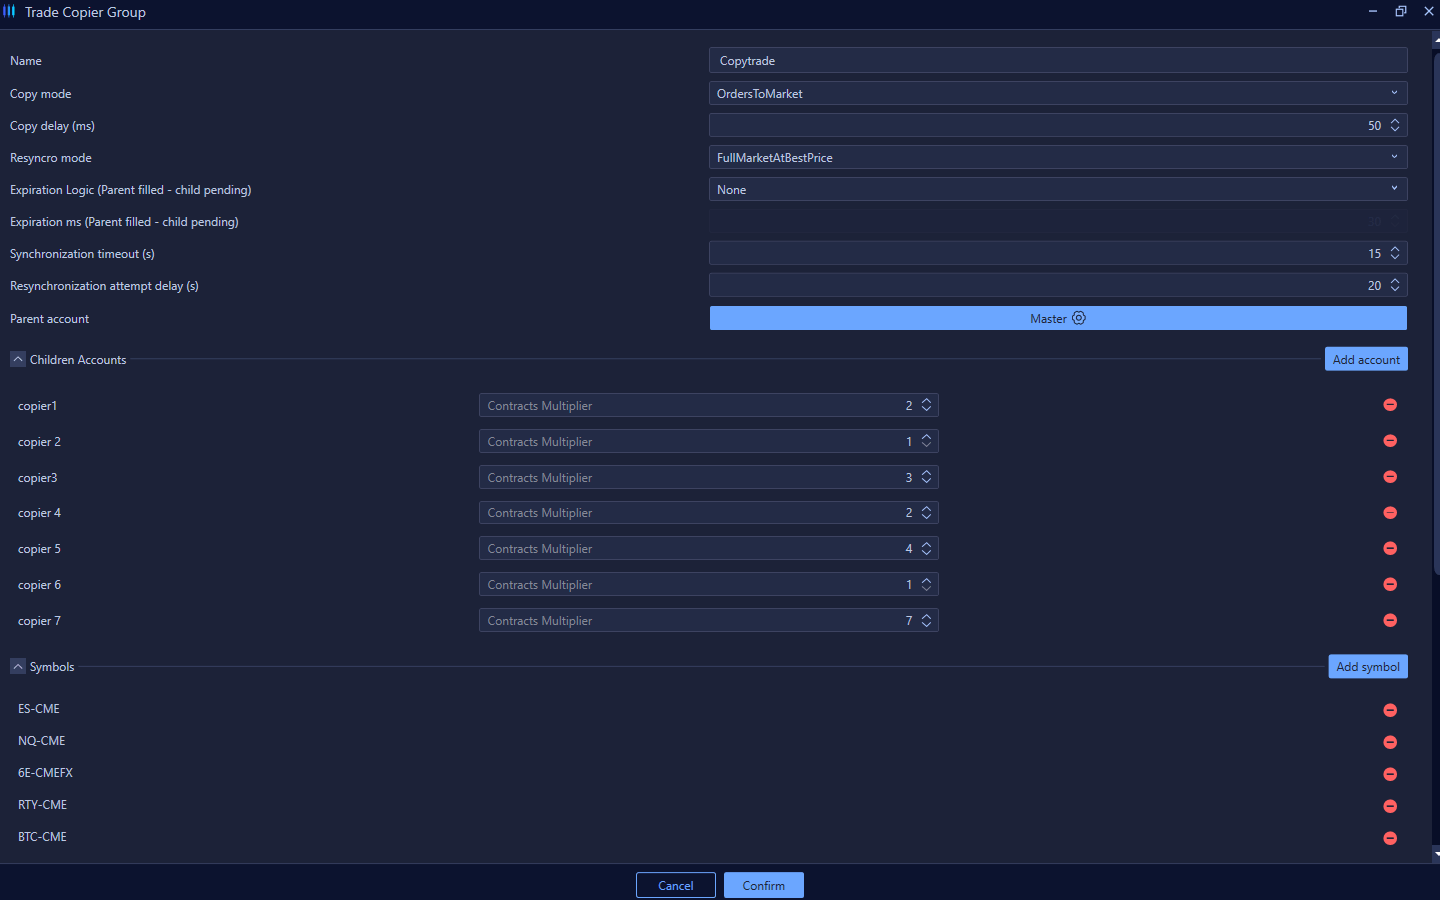
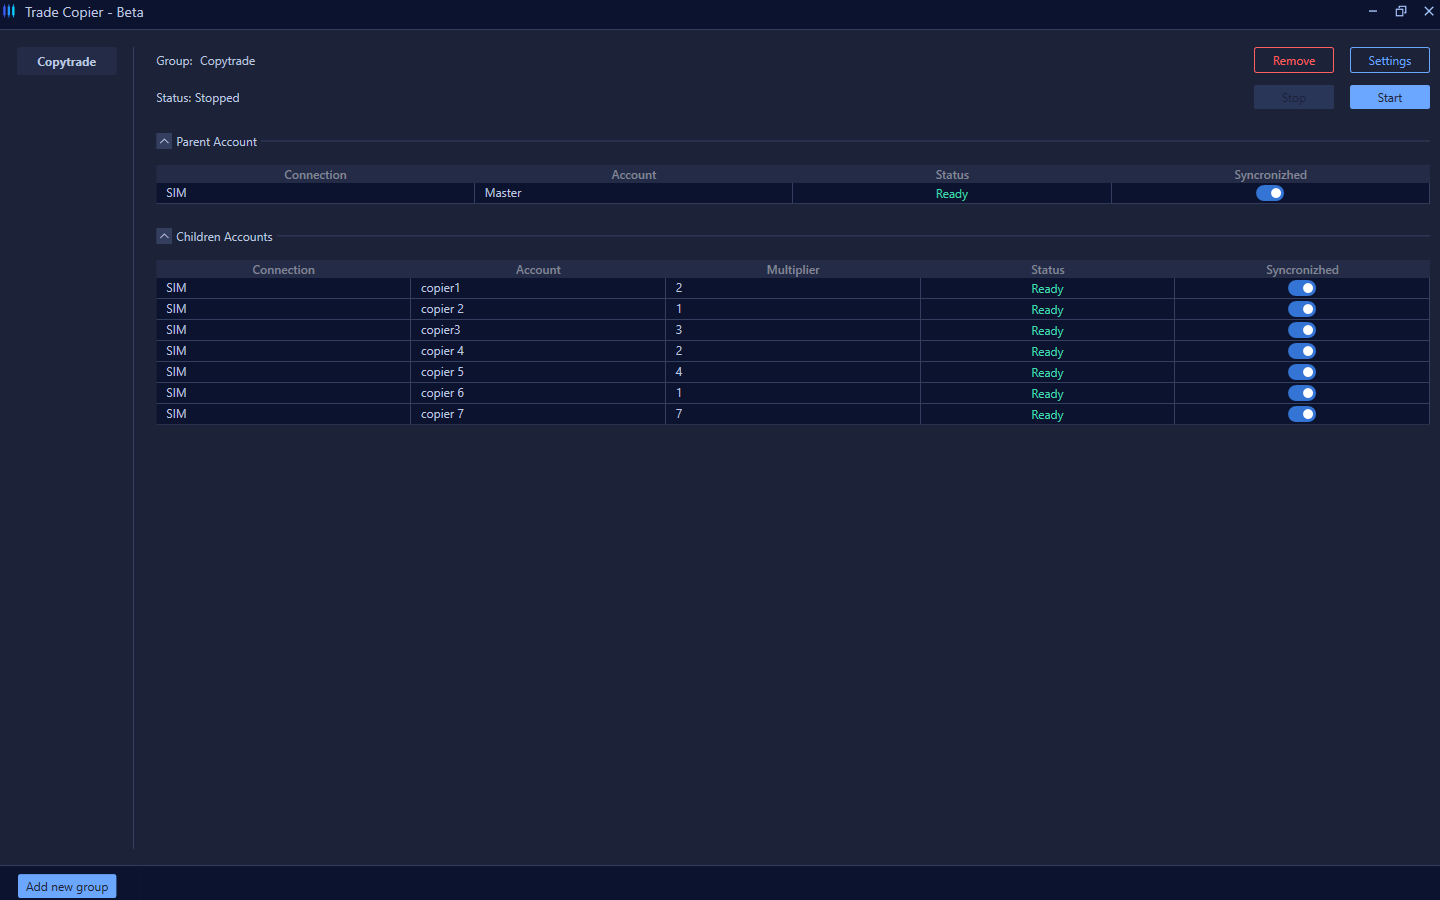
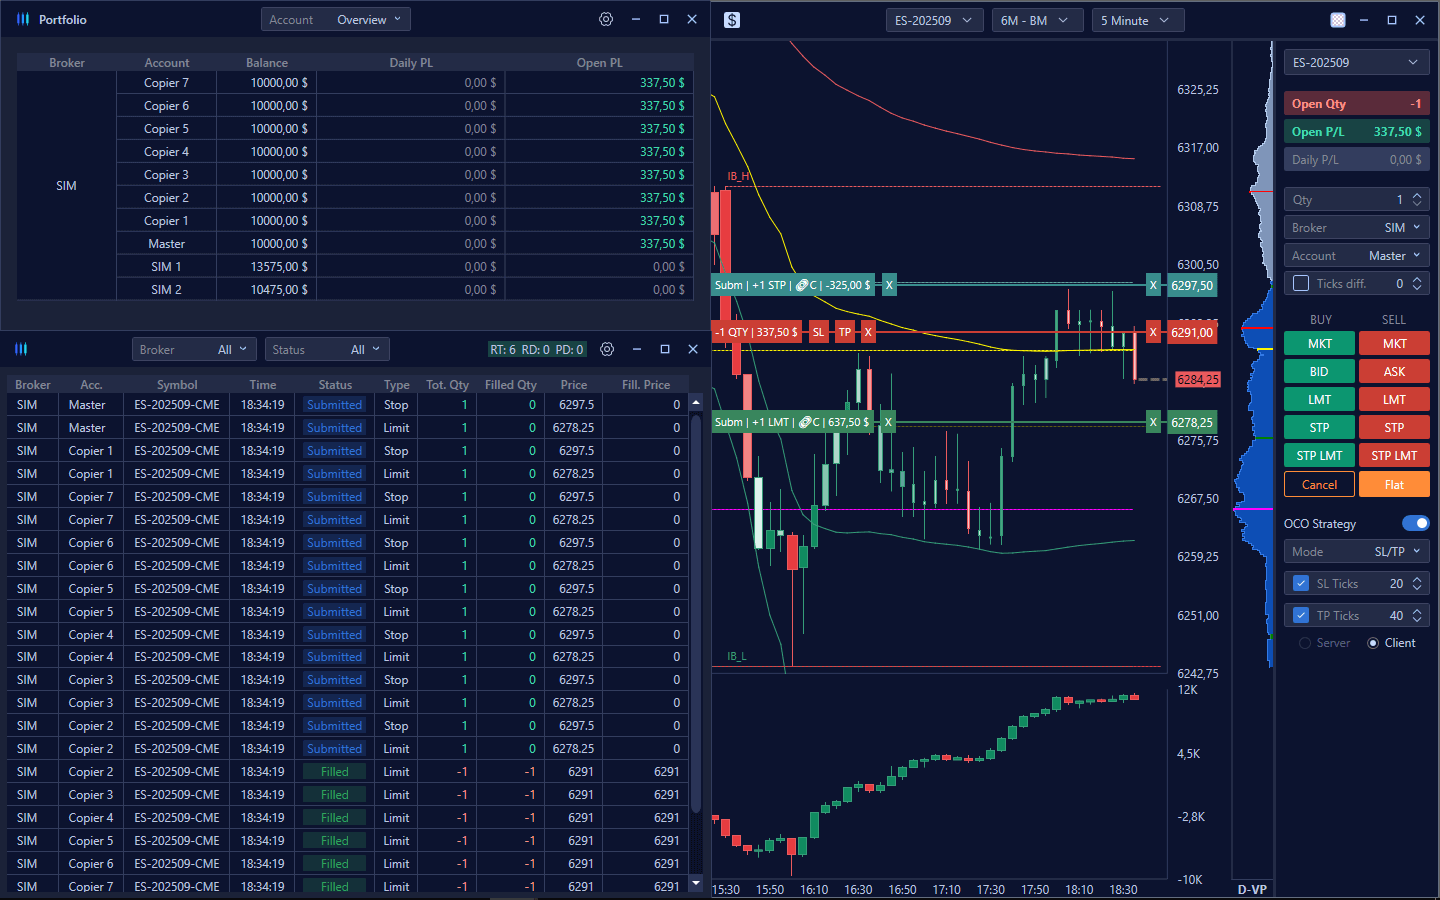
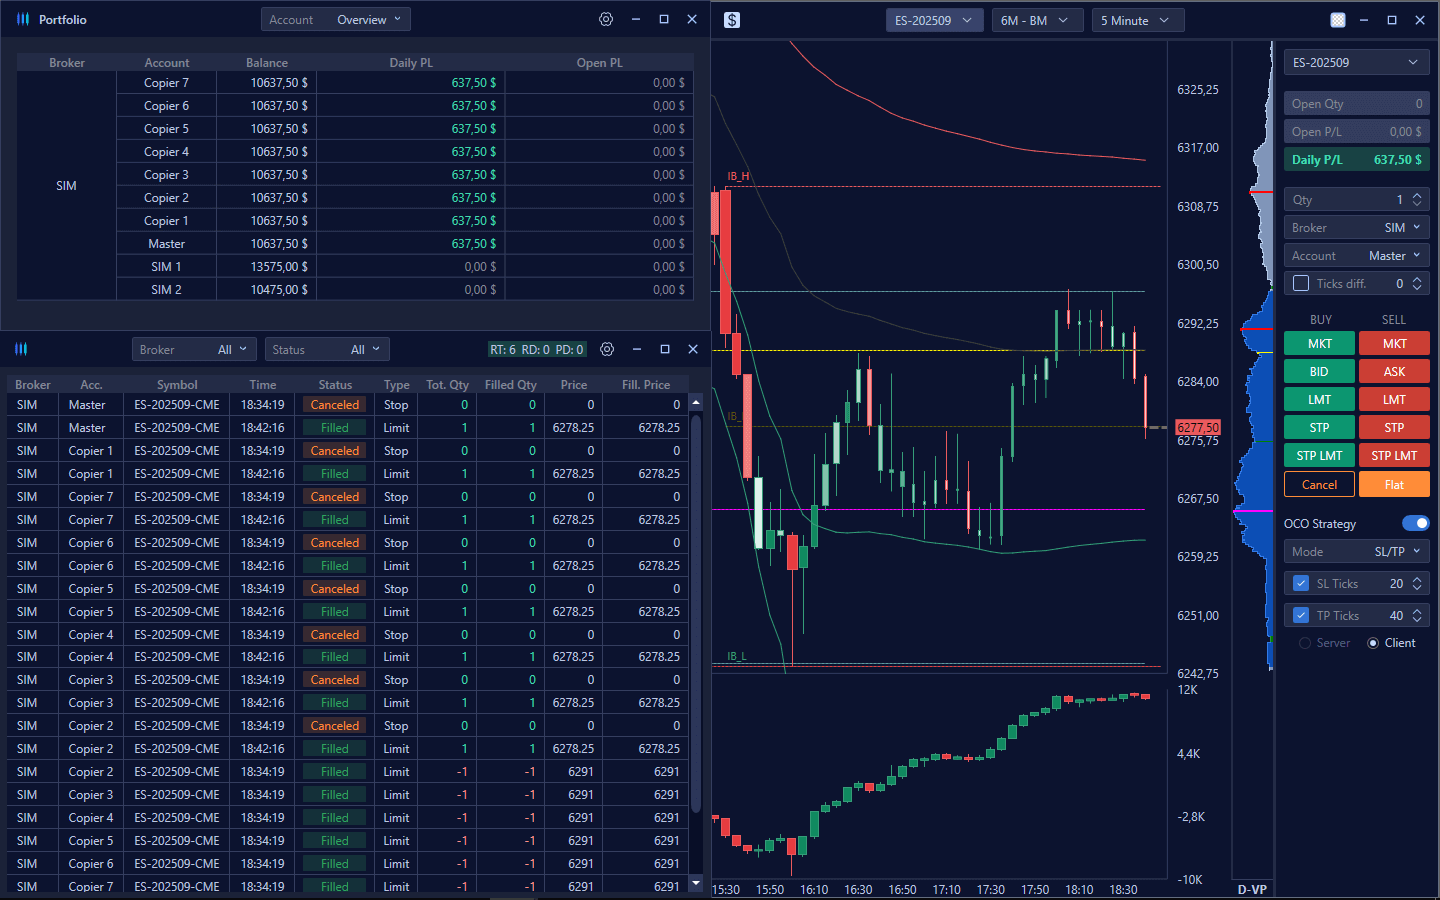
Trade CopierThe Copy Trade feature of our platform allows you to automatically replicate trades made on a main (parent) account to one or more secondary (children) accounts. In this way, one account's trading strategies can be tracked in real time and applied synchronously to other accounts, maintaining operational consistency and saving time in management. One of the most advanced features of the system is the ability to set a multiplier, i.e., a volume multiplier: this allows, for example, to enter the parent account with 1 contract and replicate the same trade in the children accounts with 2, 3 or more contracts, depending on one's desired exposure. In this way, each account can adjust the position size according to its own capital, while still maintaining alignment with the strategy of the parent account.
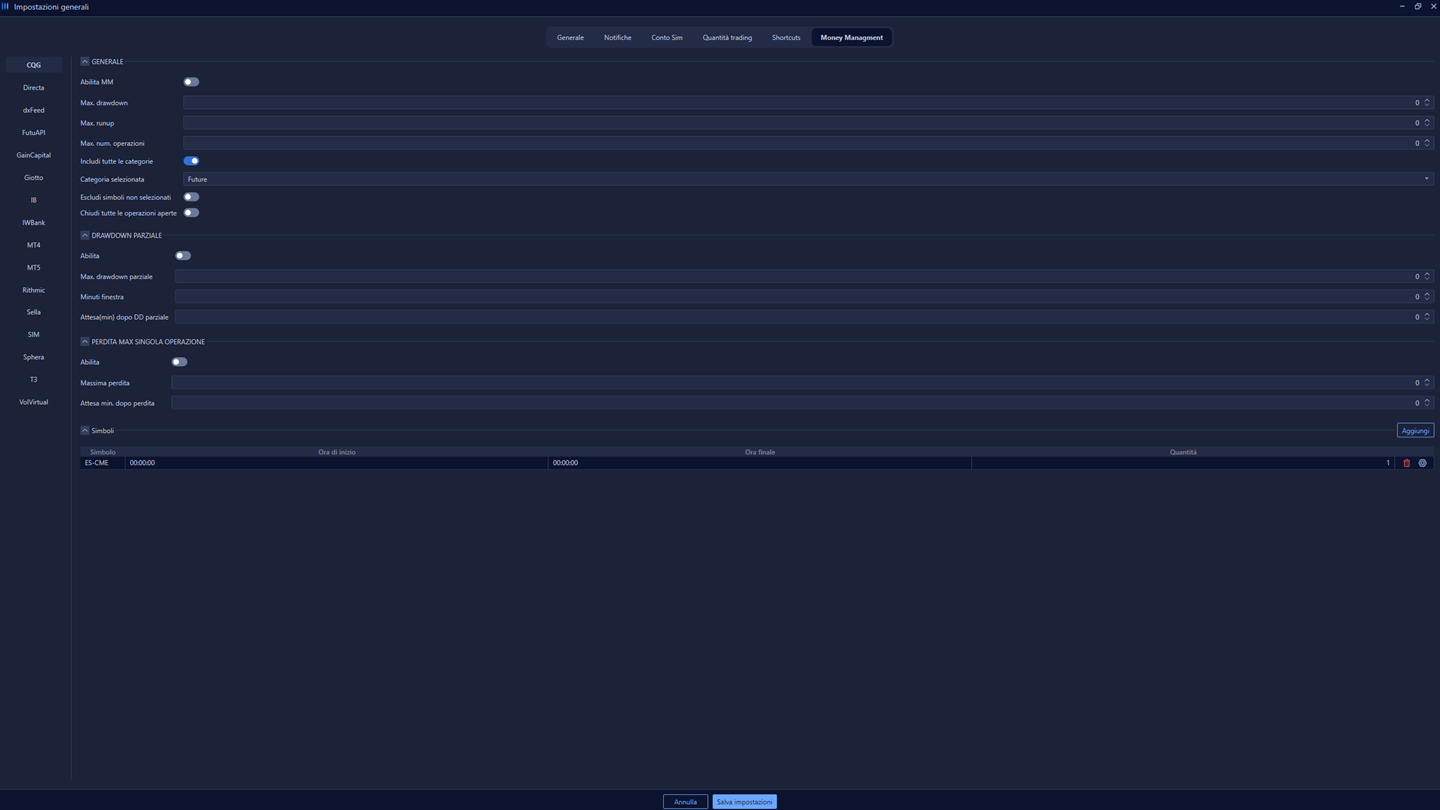
Strategy parametersVolumetrica integrates customizable capital management tools into the platform, allowing you to set parameters in line with your economic possibilities. You can define daily profit and loss limits, tailoring your trading to your risk profile in a conscious and disciplined manner.Start now
Strategy ReportIt analyzes your performance with detailed reports: statistics on trades, profit/loss, win rate, risk/return ratio and other key indicators to evaluate and optimize your trading strategy. In detail it shows the Balance of the period, Profit and Losses made, Number of Trades made and Commissions made (if you enable the relevant item). Secondly it shows other useful trading information such as DrawDown, Run-up, and the percentage of winning trades. Each piece of information is divided between Long Executes, Short Executes, and All Executes. Start now
Plans
Add Addon
VolAnalyzerThe VolAnalyzer is the ideal suite of proprietary indicators for those new to volume analysis. It simplifies the understanding of market dynamics by providing key information on fundamental volume actions such as Pressures, Absorptions, Accelerations and Exhaustions. A powerful tool for less experienced users, it opens the door to a deeper and more informed reading of the market.
We understand the desire to try the platform, one of the most frequently asked questions. Our policy of not offering a free trial is based on a desire to protect your training and operational journey. In fact, we provide comprehensive support from the very first installation and configuration, ensuring a smooth and frustration-free start.
The main reason is that volumetric analysis is not a simple crossing of surface indicators, but a discipline that requires in-depth study and solid training. It is a path that begins with the basics, with specific courses, and requires months of dedication and constant practice to form a competent trader. We see trading as a serious profession, where commitment is essential to achieve excellent results, and it is unrealistic to expect quick success without the right dedication.
Although it is different for those already using other platforms or familiar with volume analysis, for consistency we do not split the user-by-user treatment. However, to meet this requirement, we offer the option of taking out a one-month subscription to test our services. In addition, to allow you to familiarize yourself with VolSys, a basic version of VolSys Web is available, allowing you to explore the core functionality and begin to understand our approach to the marketplace. This is complemented by our dedicated support and two V Live sessions per week to give you ongoing help and valuable insights into the market.
At Volumetrica, the choice of data feed is left to your freedom, recognizing that each trader has specific needs and preferences. For this reason, the data feed is not included directly in the platform. However, we have integrated a wide range of native data feeds to give you maximum flexibility. Among them, you have the convenience of purchasing DxFeed and Rithmic directly from your personal area on our site, making the process simple and straightforward.
Our platform also supports connections with other high-quality data providers such as CQG, IQFeed ensuring you access to robust and reliable data feeds. Importantly, you also have the option of using a data feed already provided by your trusted broker, as long as it is compatible with those supported by our platform. This ensures that you can continue to operate with your preferred configurations while maintaining business continuity. For all the specific details on compatibility and how to connect, please consult the dedicated page on our website, where you will find all the information you need to best configure your trading environment.
Your training is the focus of our attention! About 8 hours of video tutorials, designed to guide you step by step in the technical use of the platform, await you within the personal area. From the simple act of opening a chart, to inserting and customizing an indicator, every aspect is clearly explained to get you up and running right away. You no longer have to feel lost when faced with new features: every step is illustrated to ensure a quick and effective learning curve.
But the support doesn't end there! On our site there is a detailed Wiki section, a veritable encyclopedia of technical guides. Here you will find comprehensive explanations, enhanced by texts available in multiple languages and explanatory images, regarding all the functions of our platforms. Whether you prefer to learn by watching a video or consulting a written guide, we have the right resource for you. Our goal is to provide you with all the tools and knowledge you need to make the most of every potential of our platforms, supporting you at every stage of your trading journey.
For maximum convenience and flexibility, Volumetrica supports a variety of payment methods, making the process simple and secure for all our customers. You can make your purchases using all major credit cards, ensuring fast and secure transactions. If you prefer the speed and convenience of digital solutions, you can also pay via PayPal, a method widely recognized for its ease of use and security. In addition, for those who prefer traditional methods or need more control over transactions, we also accept bank transfers. This wide choice allows you to select the payment method that best suits your needs and preferences, ensuring a smooth and seamless shopping experience, in full compliance with the highest security standards.
For all our clients, we guarantee a comprehensive and easily accessible technical support service, available via email and chat, including popular platforms such as WhatsApp and Telegram. We are operational from Monday to Friday, with dedicated hours to cover different time zone needs: in the morning from 8:30 a.m. to 12:30 p.m. CEST (which corresponds to 02:30 a.m. to 06:30 a.m. EST) and in the afternoon from 2 p.m. to 6 p.m. CEST (i.e. 8 a.m. to 12 p.m. EST).
In addition to chat support, for more complex issues or those requiring direct intervention, we offer the possibility of support via remote connection with Anydesk, allowing us to intervene directly on your system in a safe and efficient manner. This mode is particularly useful for troubleshooting technical faults or detailed configurations. For even more specific needs or customized in-depth sessions, calls can also be arranged on Zoom, ensuring you receive support tailored to your needs. Our goal is to ensure that you always have the help you need to operate our platforms at their best, minimizing disruptions and maximizing your uptime.
The Vol Analyzer represents a suite of proprietary indicators specifically developed to make volume analysis accessible to even the most inexperienced users, providing a clear and intuitive understanding of the key volumetric actions that move the market. This powerful tool will guide you in deciphering fundamental concepts such as Pressures (indicating the dominant aggressiveness of buyers or sellers), Absorptions (when one side absorbs the aggressiveness of the other, preventing price from moving), Accelerations (rapid price movements accompanied by increasing volumes), and Exhaustions (signs of weakening of an ongoing trend).
Thanks to the Vol Analyzer, you can begin to read the market not just in terms of price, but by understanding the underlying forces that influence it, gaining crucial awareness to make more informed trading decisions. It is the ideal tool for building your foundation in volumetric analysis, turning complex data into clear, actionable information. To delve further into the features and discover how Vol Analyzer can revolutionize your approach to trading, please visit the dedicated section on our website, where you will find all the information you need to take full advantage of its potential.
VolBook: The platform that reveals the hidden secrets of the market to you!VolBook® is a professional volumetric trading platform and offers an innovative way to visualize and analyze market depth, level 2, without neglecting the study of level 1.we made a tremendous effort to build a lightweight, clear and functional proprietary heatmap.Discover VolBook
Do you want to know more?
If you would like more information about our services, please write to us leaving your email or phone number. We will be happy to contact you as soon as possible.
Contact us
erwerwre
We and some selected partners use cookies and similar technologies as specified in our
Cookie Policy.