"Candlestick Charts": what are they?
The analysis of the price action always starts from the observation of the japanese candlesticks, that is a particular representation of the prices that we are going to study in this article
One of the main aspects of price analysis is the study of japanese candlesticks , a market analysis system using a particular representation of trading.
Japanese candlesticks are commonly referred to because, as it turns out, candlestick analysis originated in Japan between 1800 and 1900 and is the oldest methodology for graphical analysis of financial markets. Studying and analyzing Japanese candlesticks has immediate advantages even for novice traders as this type of graphical representation of prices schematically highlights the imbalance of forces between buyers and sellers in every single trading session; it certainly represents a great advantage over the classic line graph, as it also highlights the history of the movement which can sometimes be important in its analysis.
To construct Japanese candlesticks and identify the main figures of this methodology, the four summary trading prices in a precise time-frame are sufficient, the 4 main parameters are represented in the figure and are called: opening , maximum , minimum and closing .

Each single candle is in fact made up of:
Main or real body : body of the candle, obtained by combining the opening price with the closing price.
Shadow : are the thin lines that connect the maximum and minimum (High and Low) of the seat to the body, respectively defined: Upper shadow - Lower shadow
Each candle can take on a different color (generally the most used configurations are red and green, or black and white) depending on whether the closing of the market is greater "Positive session" or less "Negative session" of the relative opening.
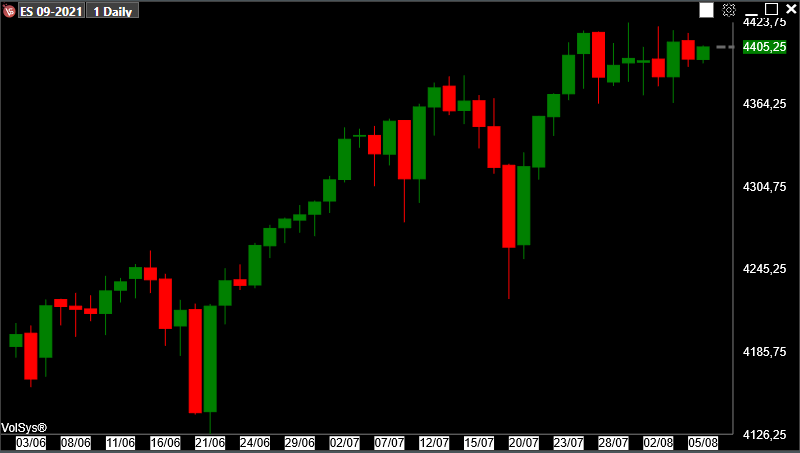
In our trading platforms it is possible to set the color of the candlestick chart as desired, by default it will look like this:

We have decided to leave the maximum possible customization to our Traders, it is therefore possible to change the color of the background, of the individual candles, of the text, of the graphic objects etc.
Now let's analyze the types of candles that we can encounter during the trend analysis:
1. Long green body:

A candle with a very large body has strong bullish implications. The market went in one direction, bullish.
Prices, after the opening, pushed upwards, closing close to the trading peaks. In the event that the opening coincides with the minimum of the session and the closing with the maximum, this candle represents the maximum bullish force that a market can express and therefore presents itself without "Shadow" (or in any case with "Shadow" almost non-existent) . In this case we speak of "Marubozu".
The presence of this imbalance of forces in marked favor of the buyers paints a potentially bullish scenario also for the following session.
2. Long red body:

A candle with a very broad body and it is a figure with strongly bearish implications. It is a pattern exactly mirroring the Long green body, it highlights a decisive prevalence of sellers over buyers. Potential reductions are deducted in the next session. Prices, after the opening, pushed downwards, closing close to the trading lows. In the event that the opening coincides with the maximum of the session and the closing with the minimum, this candle represents the maximum bearish force that a market can express and therefore appears without "Shadow" (or in any case with "Shadow" almost non-existent) . In this case we speak of "Marubozu".
3. and 4. Small body / Spinning top:

This type of candle indicates substantial market stability. They have a body that is too small to allow for the assessment of the imbalance between buyers and sellers regardless of the color of the individual candle. They represent moderate downside or upside potential, respectively.
5. and 6. Upper shadow lines:

In the Japanese candlestick strategy the upper Shadow has bearish implications under certain conditions. These patterns, to have bearish implications, must be after a pronounced up trend. The upper shadow means that the attempts of further hikes made by the buyers have not supported the pressure of the sellers who by rejecting have created a rather important Upper shadow. Near the highs of this figure creating a so-called resistance area. The type of candle indicates weakness for the next session as well.
7. and 8. Lower shadow lines:

Bullish implications. This candlestick pattern is specular to the previous one and to take on meaning it must form after a pronounced down trend. In this case, the further bearish extension attempt found a return of buyers who raised prices. A support zone can be identified near the lows of the candle. This pattern generates a bullish expectation for the next session as well.
9. Doji:

The situation of absolute equilibrium
The absence of the real body (opening = closing) is an expression of maximum balance between buyers and sellers and market uncertainty. The doji identifies that the 'market is at a crossroads'. The formation of a doji after periods of strong market direction is very significant. Often the direction of the market for the following sessions is signaled by the violation of the maximum (upward trend) or the minimum (downward trend) of the doji.
Conclusions
The price analysis with Japanese candlesticks is certainly one of the first approaches for those who start to approach the financial markets and study the Japanese candlesticks, the mechanisms underlying their formation, the individual candlestick patterns is certainly essential to then continue with the study of further aspects of the market including the study of volumes; as we always say the correct combo is price and volumes, you cannot study volumes without having the basic notions of technical analysis.
In the next articles we will study the various patterns that can be recognized and exploited through the candlestick chart with the hope that this article has been of your interest.
Are you intersted on what you are seeing?
If you want more information about our services, please contact us leaving your email or mobile phone.